Welcome to 301 – Advanced Charting.
Power Chart is a module that can be added to Power Practice. It allows users to enter treatment and periodontal readings into visually represented charts, along with enhanced patient alerts, clinical notes, and more.
Power Chart integrates seamlessly with most digital imaging systems and enables offices to make a smooth transition to a paperless system.
This advanced course is designed to provide participants with a greater understanding of the Power Chart module and it’s features. The aim of this course is to bring to your attention the available functions and conveniences added with Power Chart and help you get the most out of them.
We will discuss the settings available within each module in detail, along with creating Super Codes and Comment Templates, setting unique producer colours, filtering treatment history and much more . We’ll explore the Treatment Proposals module, the improved Chart Alerts, the Document Manager and even custom reports using the Info Manager.
This course is not intended to teach the basics of daily use for the Odontogram or Periodontal charts. For help in those topics, please call our Training department.
As with previous courses, we recommend you follow this course using the Training database Power Practice comes bundled with. Use it as a contained practice area where you can implement what you’ve learned to complete practice exercises and test out new settings.
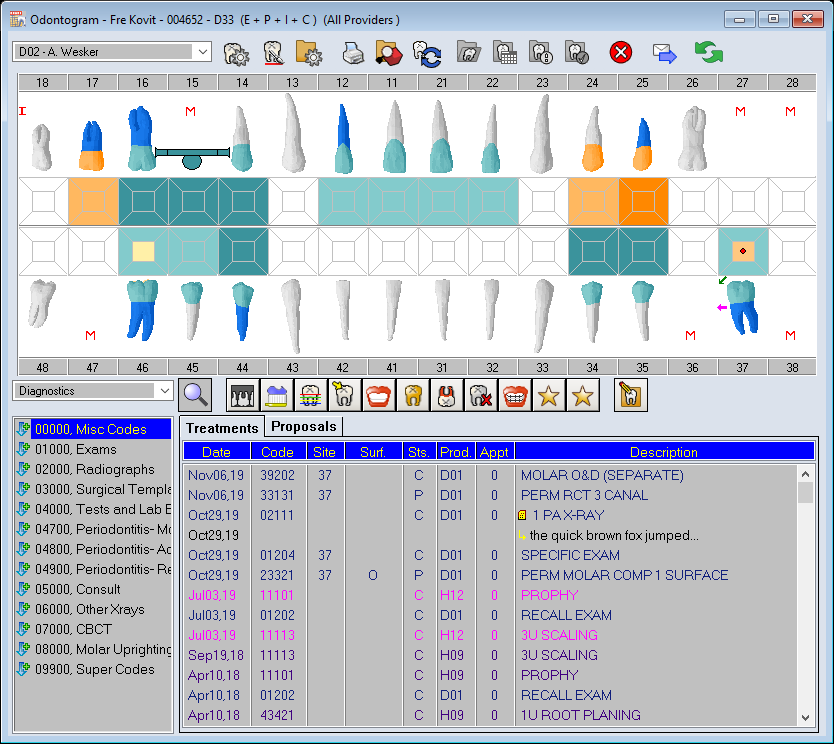
We will begin in the Odontogram, found under the Charting Menu atop the program.