Description
version 5.1+
The Monthly Goals tab of the new Practice Analysis module will help you quickly review your financial goals and progress, as well as allowing you to easily compare production over different timelines.
Step-by-Step
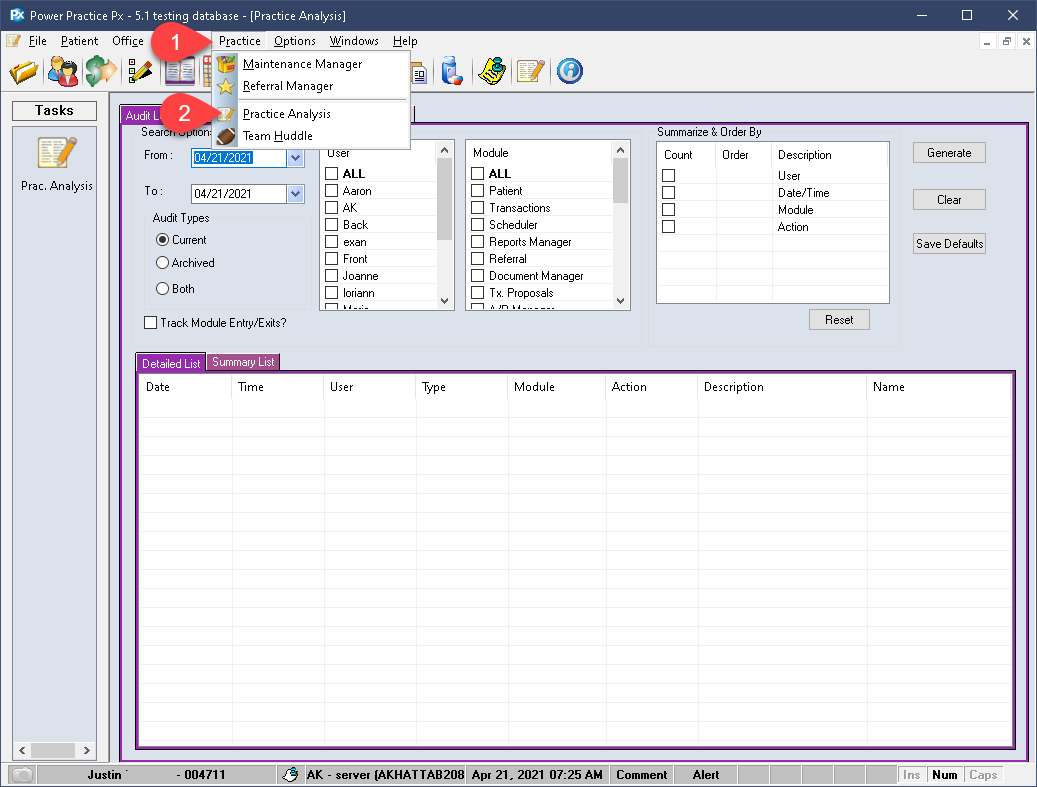
- Visit the Practice Menu atop the program window.
- Select Practice Analysis.
Setup:
We will need to setup some parameters for this report.
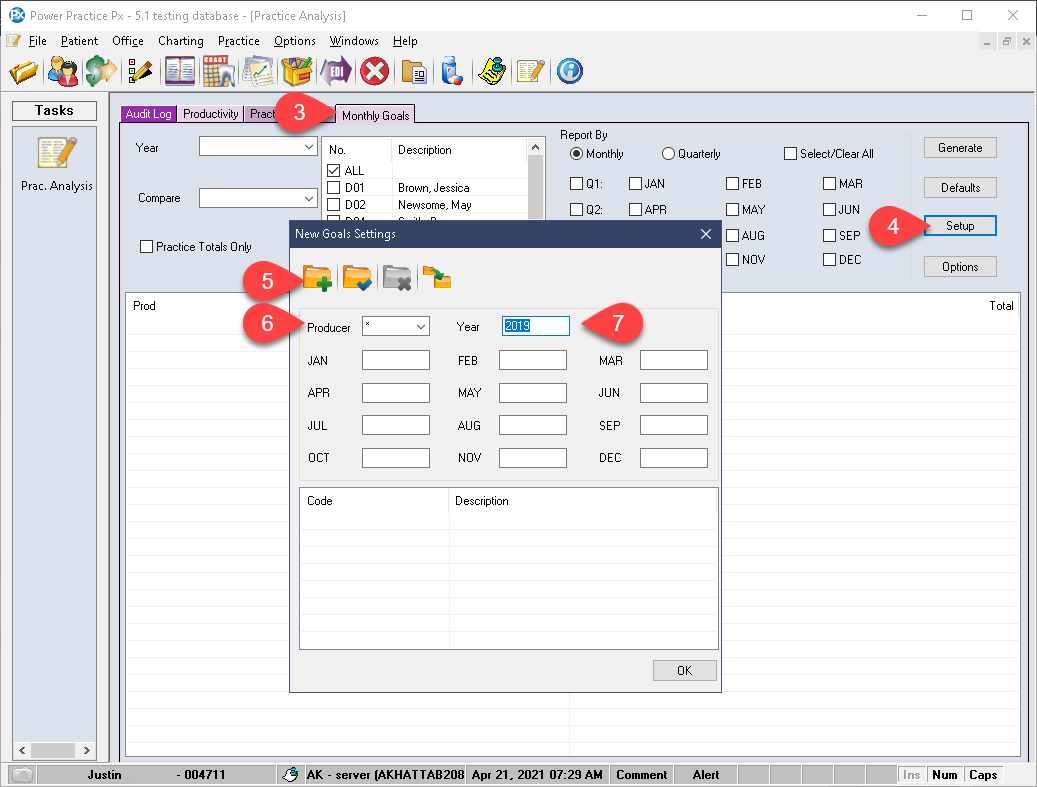
- Set the tab to Monthly Goals.
- Select the Setup button on the far right side. Here we will setup some baseline options, specifically, defining a specific year and it’s monthly targets.
- Add a new record using the + folder icon.
- Set the Producer dropdown to For All, or as desired. You can choose to report on All Doctors, Hygienists, or Auxiliary producers. You can also report on one specific producer from the list.
- Designate the year date here. For example, 2021.
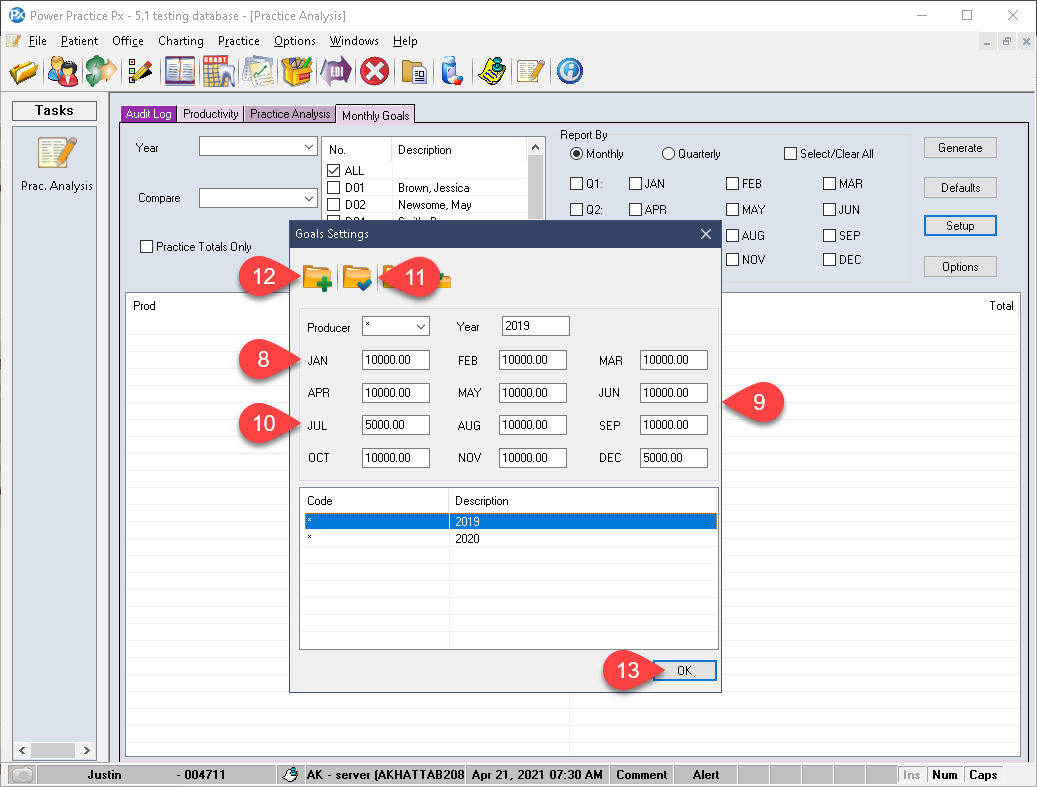
- You can now set the financial goal for each month of the year by entering the dollar value in the monthly boxes.
- This will then auto update all other boxes to match for your convenience.
- You still have the option to manually override all the boxes after. For example, if you need to set a lower goal for the months your office is typically closed or operating below capacity, you can easily do so by changing the value in that month’s box.
- When you are happy with your goal figures, select the Save check mark folder to proceed.
- When you have the time, you should create a record for each year you wish to report on.
- Select Ok to close this window.
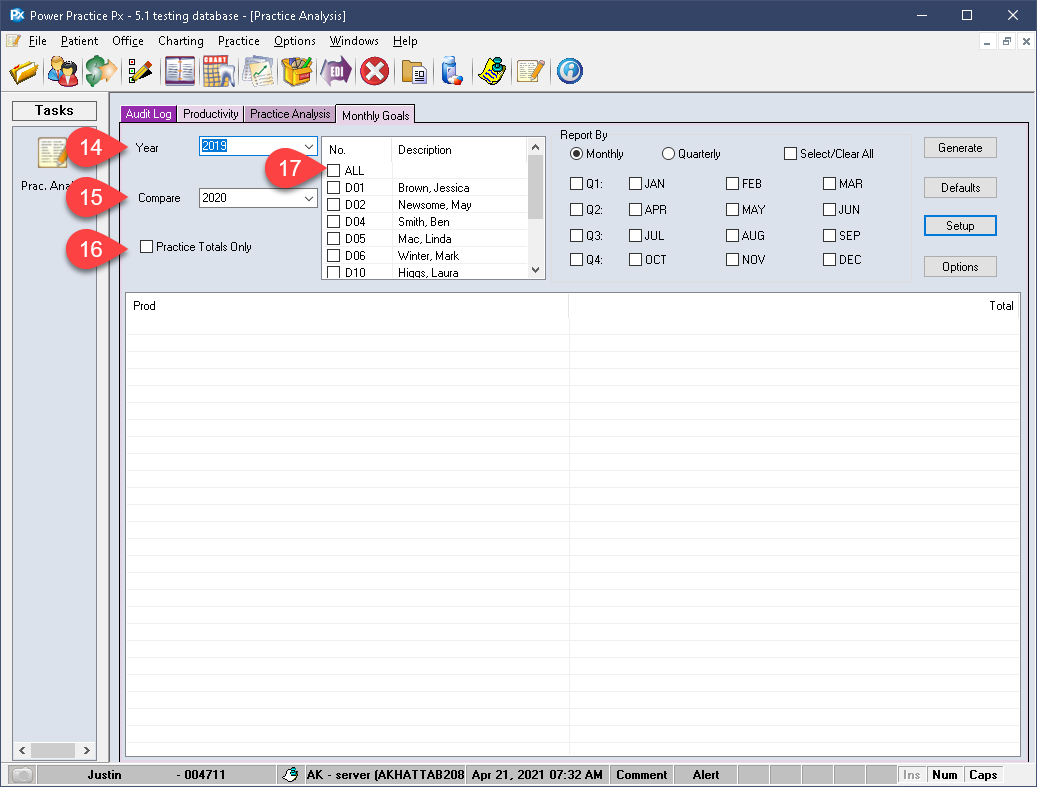
- Back on our main report page, lets set the Year dropdown.
- Choose another record to Compare against from the list, if you wish.
- Print Practice Totals will condense the report into a single Total line. You can use this for a simplified report or run it in full for details.
- Select the producers you wish to include from the list.
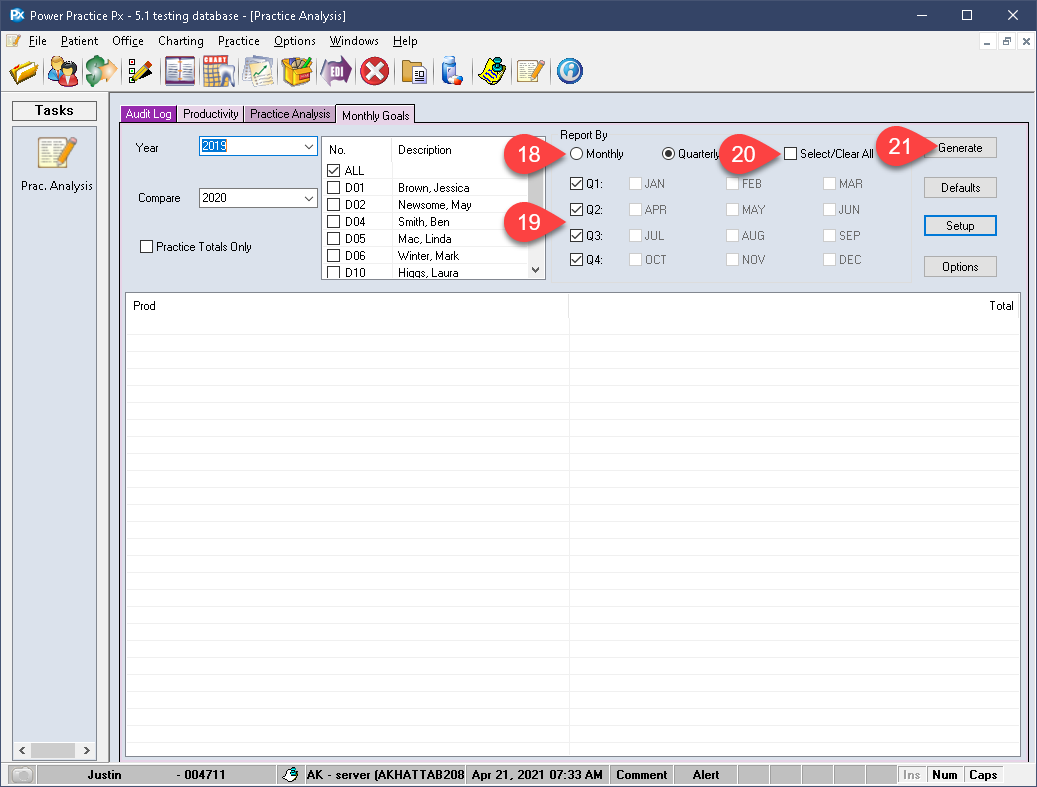
- Report By can be set to a monthly option or a Quarterly option. This selection will be based on user preference. The Quarterly view is much tidier and easier to follow, it will be used for the purposes of this article. The monthly view provides far more control, use it to take a detailed look at your production totals month-by-month.
- Either choice will require you to select which tick boxes to include. Make your selections to best suit your needs.
- Select all/clear all will help you quickly change your selected tick boxes.
- Select Generate.
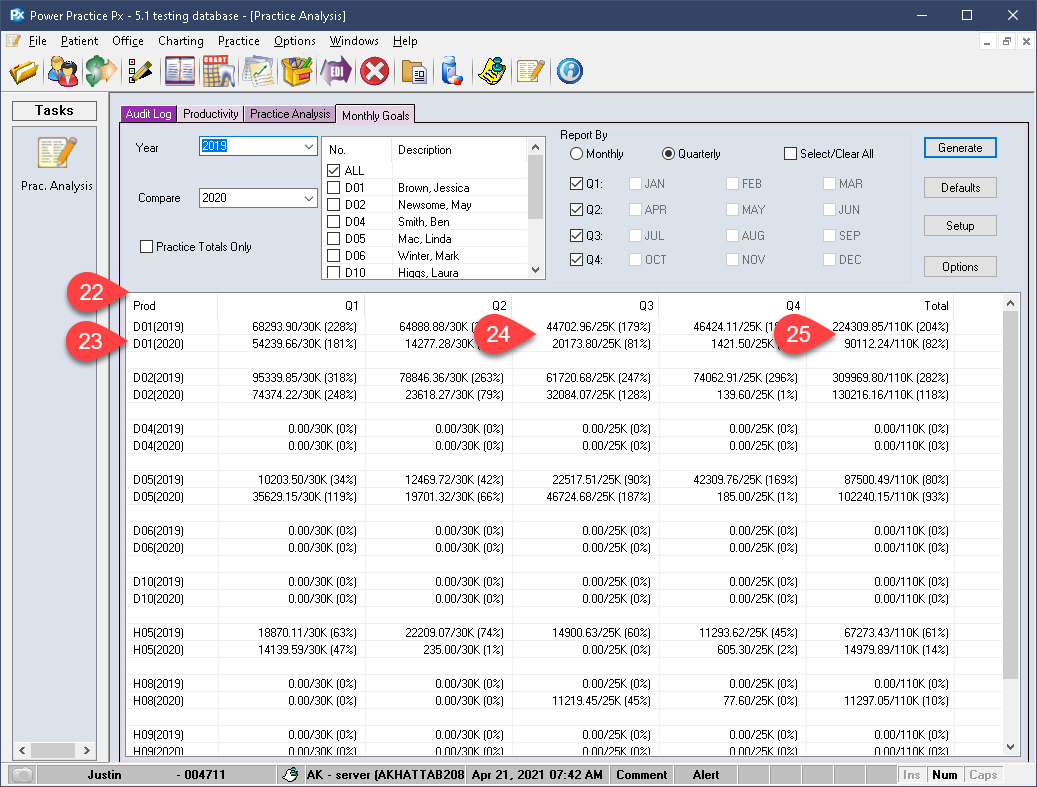
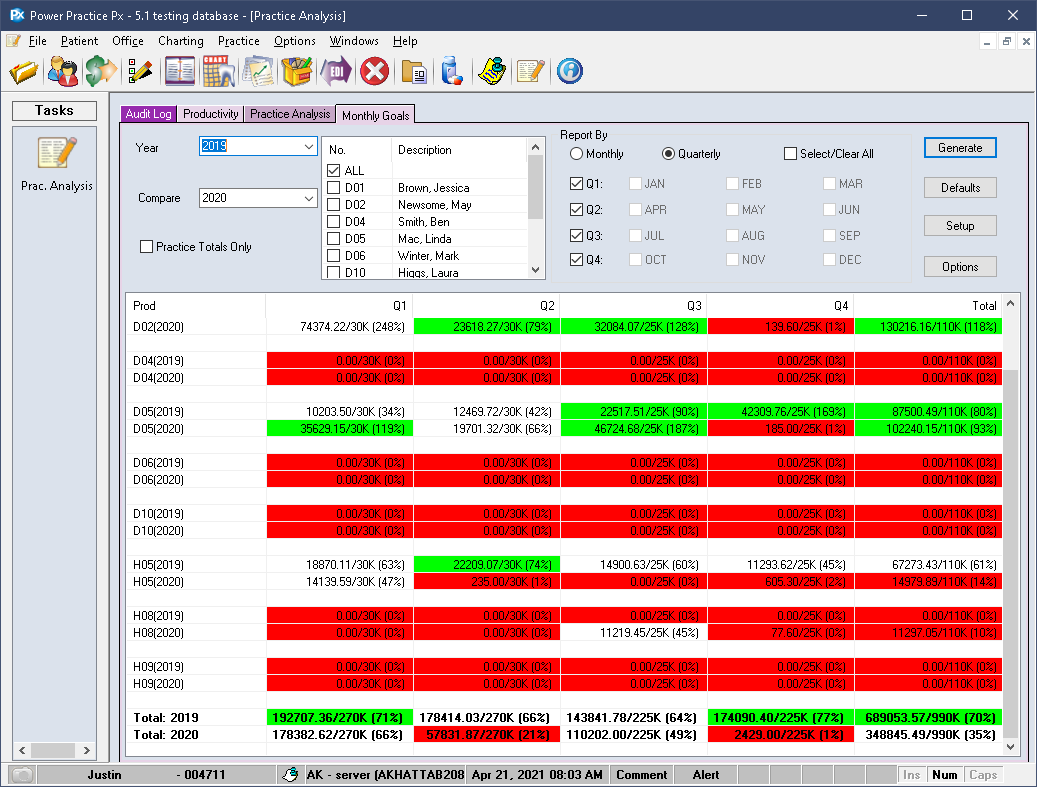
- Your results will populate in the grid below.
- Each producer is given a line of their own, in my case Q1 shows a line for D01 for both years chosen.
- Following the columns across horizontally, we see the quarters or or months broken down for the producer.
- Finally, we see the Totals for that producer on the far right side.
- Moving vertically down the columns we see each producer’s breakdowns.
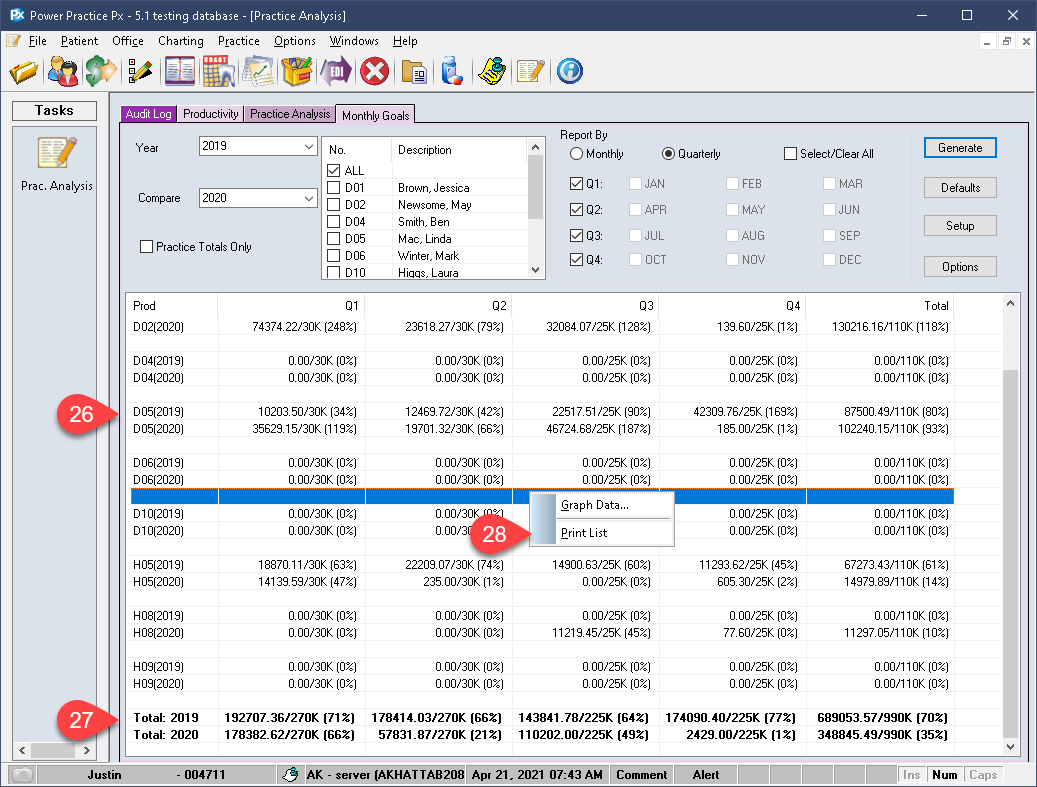
- At the bottom of the report is a total line for each year chosen. This is an aggregate of all your producers included in the report. The report will only calculate the production values of the producers included in the report.
- You can right click in the report area to print the results.
Buttons:
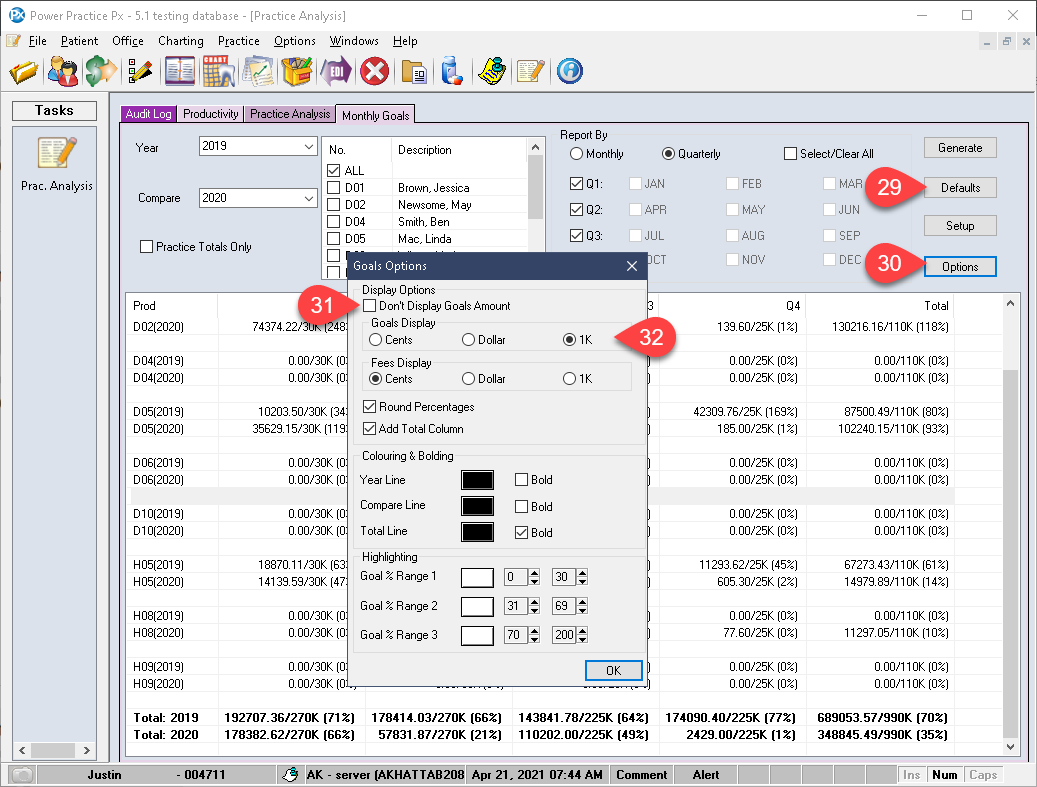
- Returning to our buttons above, the Defaults button will preserve all your current selections/preferences and open this module with those options pre-selected.
- Select the Options button to open the related window.
- Don’t Display Goals Amount will hide the target amounts set for each month or quarter, showing only the report data. E.G. instead of showing 1,000/10,000(1%) (production so far vs. production goal set for this month or quarter) the program will instead show the current production only, so 1,000(1%). This option greatly helps in reducing “noise” on your results. It is highly recommended.
- Goals Display can be set to Cents, Dollars, or 1K. This will change how your reported values appear. Cents will show the full figure, followed by the cents (1,000.25). Dollar will cut off the cents portion (1,000), and finally, 1K will simplify data to show as 1k (k= thousand).
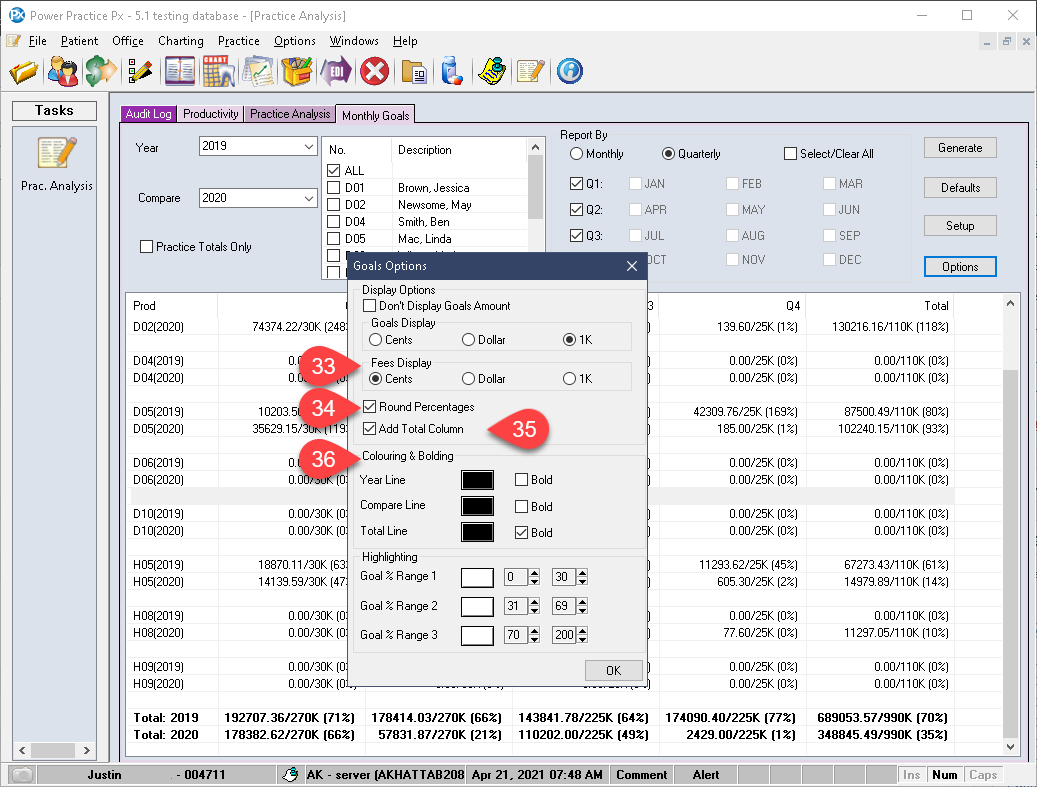
- Fee Display will follow the same logic/parameters as the Goal Display. Make your selections based on preference.
- Round percentages will round up or down to the nearest whole value when enabled.
- Add Total Column is highly recommended, it will add the Totals column at the end of each producer’s breakdown.
- The Colouring & Bolding options will affect how your results are displayed. They can be Bolded or given a unique colour to make them easier to read at a glance.
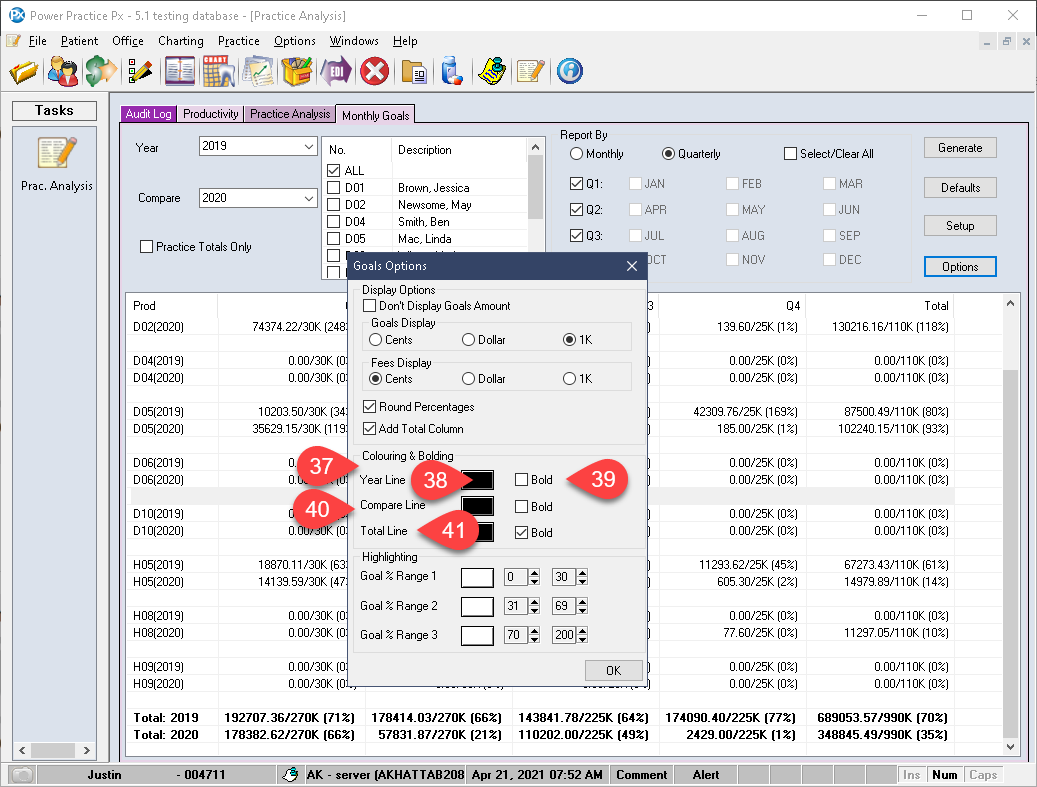
- Year line relates to the first dropdown on the report, the Year option.
- The colour box can be selected to set a custom colour for this line.
- The Bold tick box will bold the font of the selected line.
- The Compare option will adjust how the comparison year used will display, if included in your report setup.
- The Total Line is related to the final lines presented at the end of the report.
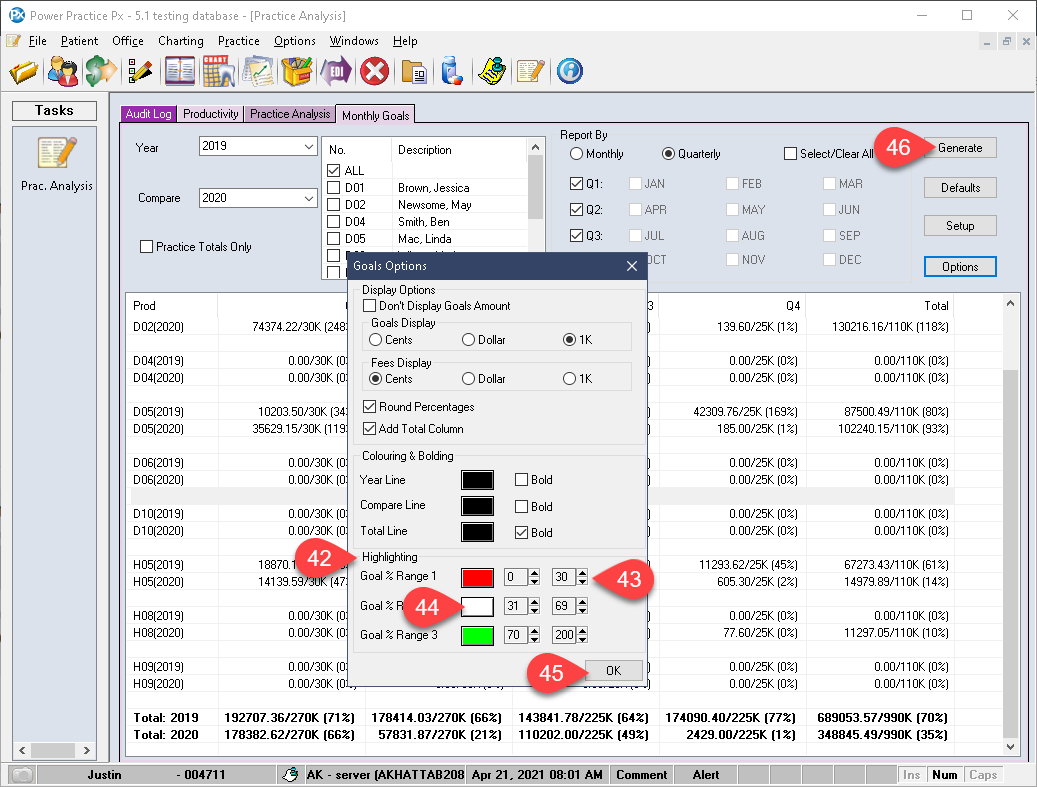
- The Highlighting options allow you to define % ranges which are then used to colour code your production results. This makes it easy to determine whether you are on track or falling short at a glance.
- To define a percentage range, set the dials to the ranges you wish each to encompass.
- Select the white box to choose a colour for each range.
- With your ranges set, you can select Ok to close this window.
- Run your report to see the new colours in action.
Should you find the colours to be too distracting or confusing, you can revisit the Options window and set all the colour boxes appropriately.
The first set of colour boxes relate to the Font. Set those back to Black. The second set of boxes relate to the % range. Set those to White.
Additional Resources
