Description
version 5.1+
The Case Acceptance Report will allow you to review vital statistics on Planned, Incomplete, and Proposed treatments. It will clearly demonstrate the acceptance and completion rates of your producers, giving you an opportunity to identify weak points in your treatment planning, booking, and completion so you can further optimize your patient care.
This report will only track the changes for new planned treatments entered after the update to 5.1 and with auditing enabled.
Step-by-Step
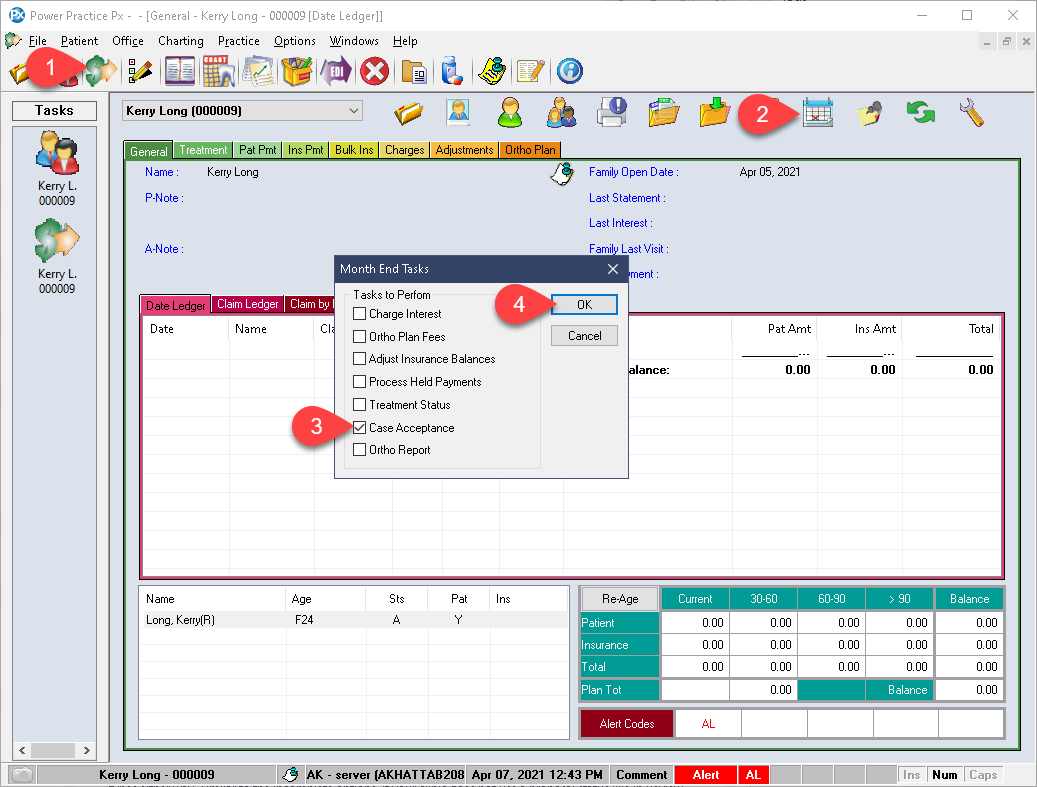
- Visit the Transactions module.
- Select the Month End Tasks icon.
- Select Case Acceptance.
- Select Ok.
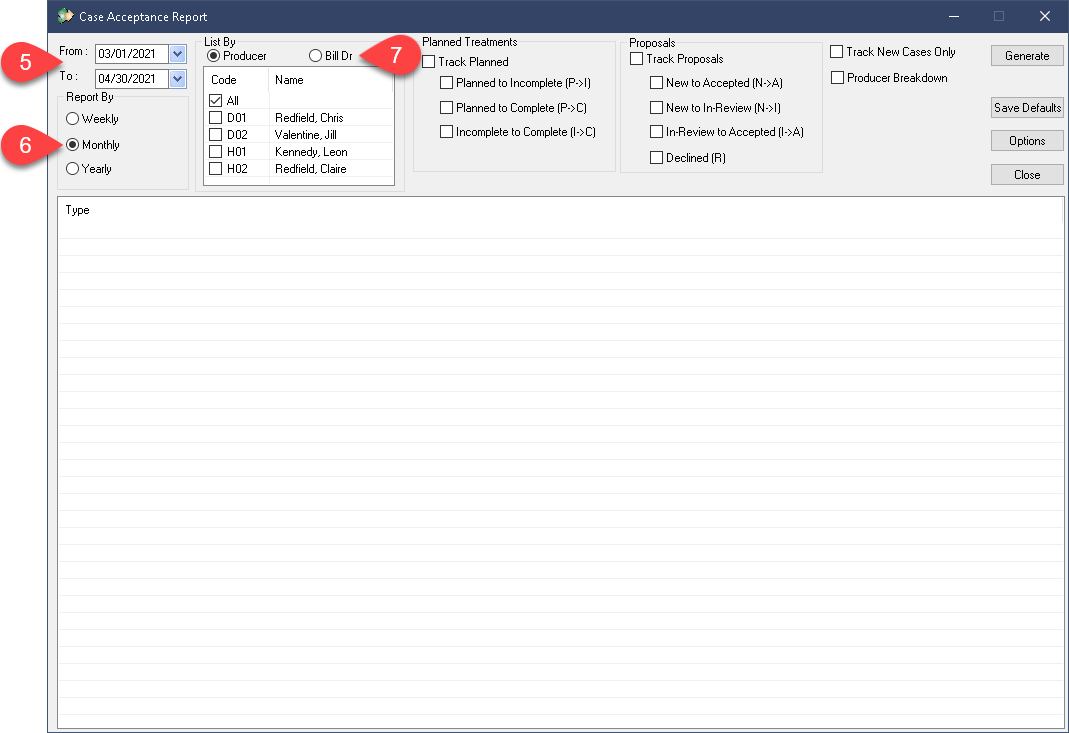
- Begin by setting the date range to search within.
- Choose the Report By method, breaking things down into weeks, months or years.
- Set List By to Producer or Billing Dr. If you typically report by Producer, do the same here and vice-versa.
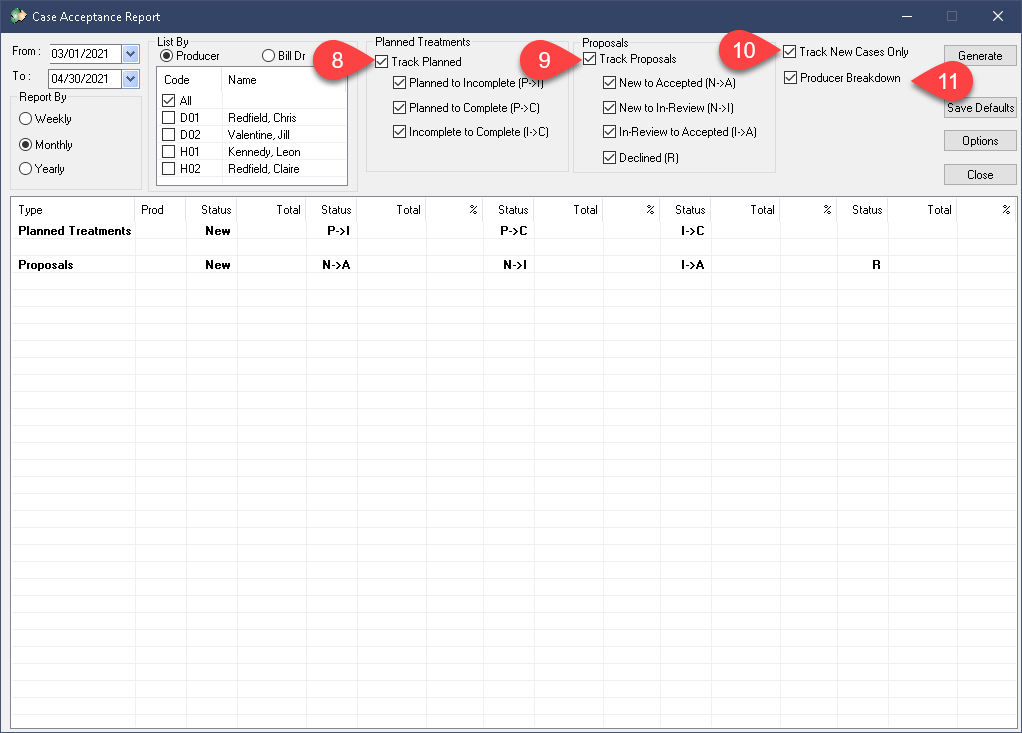
- Enable the types of Planned Treatments you wish to track. If your office does not use the Incomplete status, you can leave Planned to Incomplete and Incomplete to Complete unchecked; focus on P->C instead.
- You can choose to track Proposals at the same time, or run it later on it’s own. The report will separate the result types either way. Similar to the Incomplete options, if your clinic does not use a proposal status like In Review, exclude it from your search options.
- Track New Cases Only will exclude any proposals created outside of the designated date range.
- Producer Breakdown will present the data with the producer’s associated to it. This is highly recommended if you wish to review each producer’s planned or proposed delivery rate. Leaving this option disabled will simply present the results of all producers combined.
We will return to address the Save Defaults and Options buttons at the end of this article.
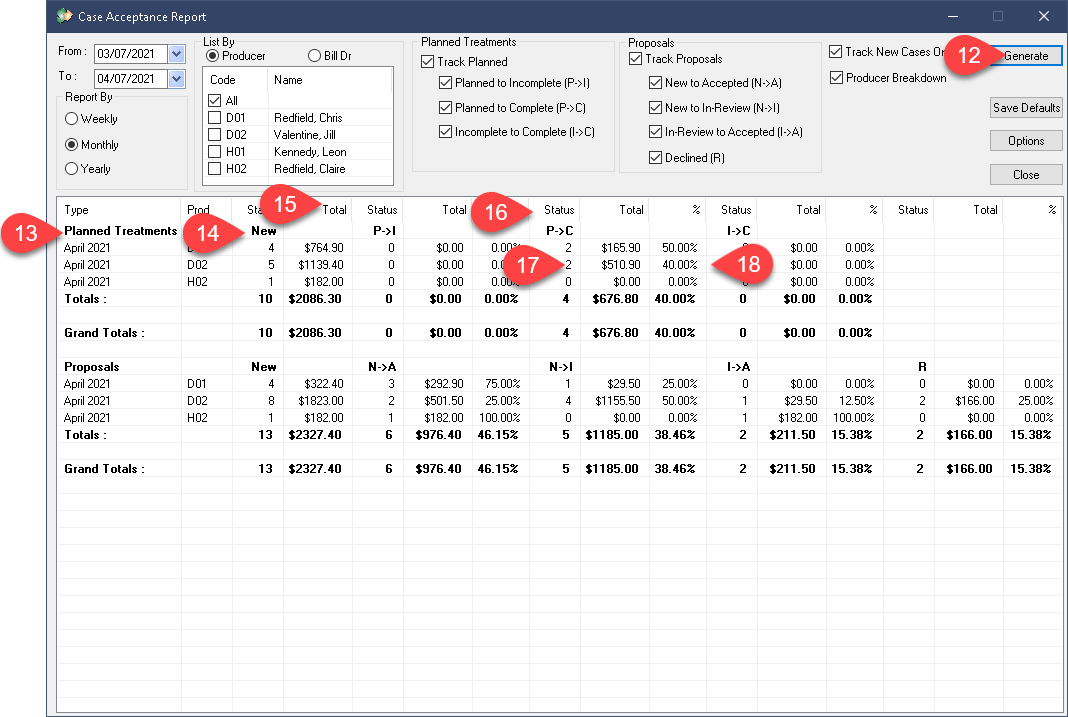
- Select Generate.
- Your results will appear in the grid below. If you included both types, you will find the Planned item breakdown followed by the Proposal breakdown.
- Following the D01 line shown in the example image, we see D02’s new planned treatment count.
- The Total value column shows the estimated financial production.
- The P->I, P-> and I->C behave very similarly, they show the total number of treatments that underwent the status changes.
- Then it provides an estimated dollar value to those items.
- Finally, it displays this conversion rate as a percentage for ease of review.
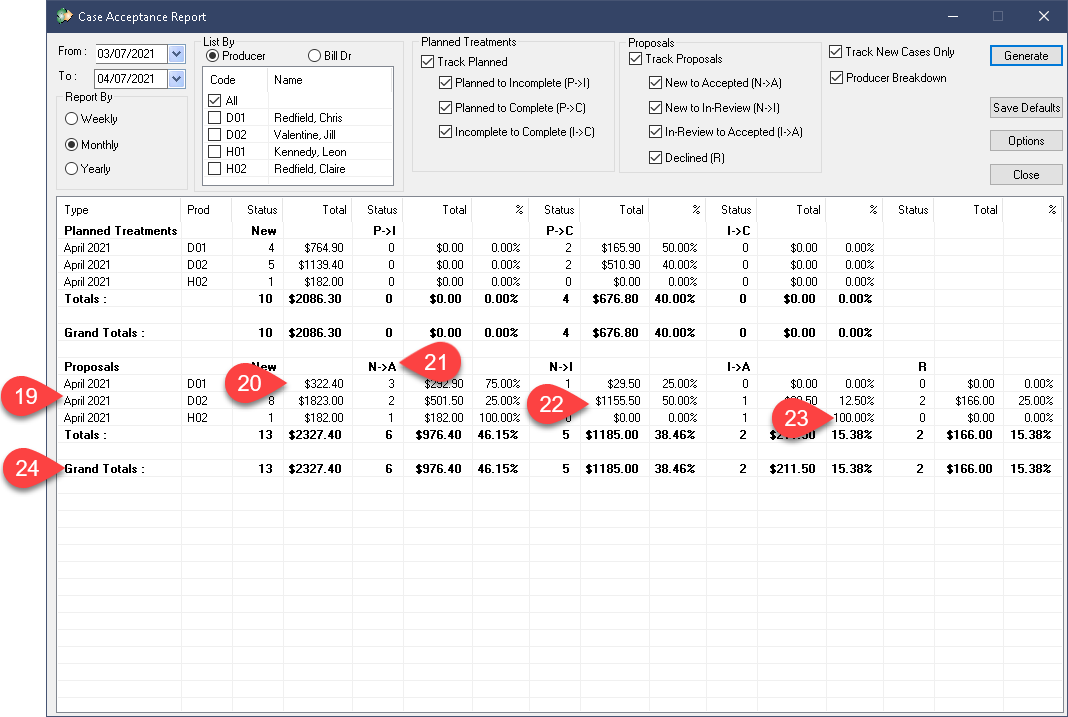
- The Proposal results are next. Much like the Planned results, this breakdown follows a near-identical pattern. The total Proposed treatments for each Producer are shown.
- They are given an estimated dollar value.
- The conversions abbreviated are New to Accepted, New to In Review, In Review to Accepted, and finally, Rejected items.
- Each is broken up into Total dollar estimates.
- Then given a percentage calculation.
- The overall totals are all calculated below in the Grand Totals row.
It is worth noting that using the right click on the report results area will present an option to Print or export the report to Excel.
Options:
We will quickly return to the extra buttons available beneath Generate.
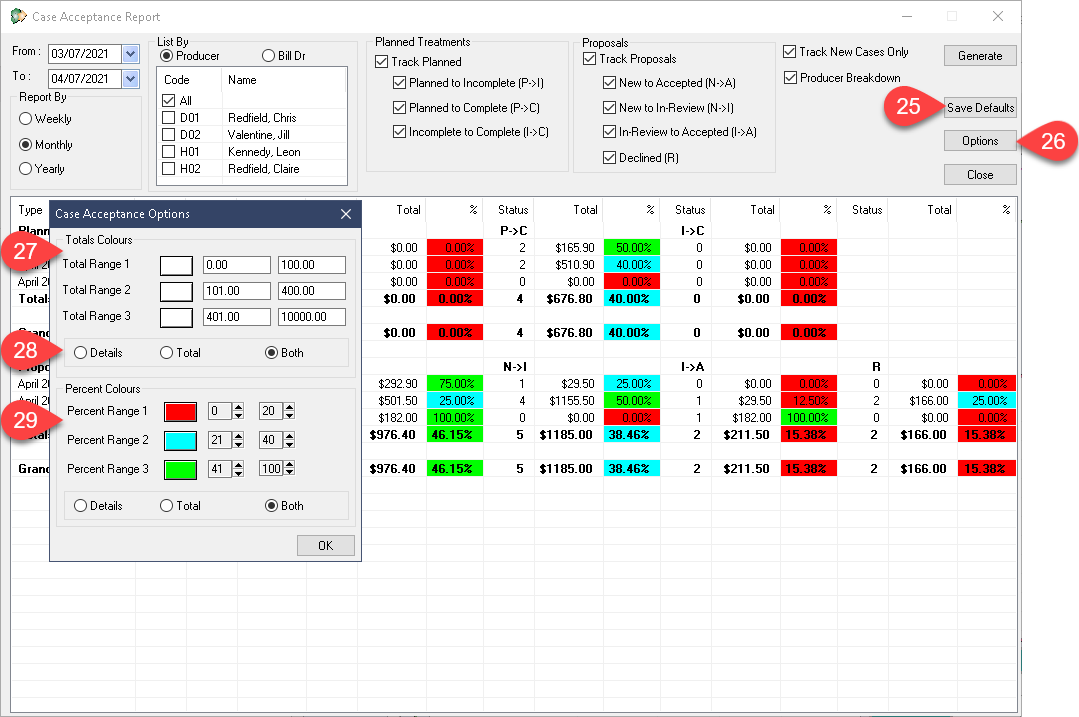
- Save Defaults will preserve your tick box selections so you don’t have to reset them each time you return to this report.
- The Options button houses some more interesting features.
- The Total Colours options allows you to define up to 3 ranges and designate colours to them. This will colour code your results depending on which “bucket” they fall into.
- You can choose to apply the colour coding to the Details, Totals or Both. The Totals option will colour code the Totals row only; Details will apply the colours to all of the listings in the Total column.
- The same options are presented below for the Proposal results. The values are simply replaced with percentage ranges instead. This makes reviewing your results much easier as you can set the first range to cover 0-40%, the next 41-70% and the last as 71-100%. You can immediately see whether the producer, or office, are successfully delivering a satisfactory percentage of proposed care plans.
