Description
version 5.1+
Within the updated Practice Analysis module, the new Productivity tab will allow you to report on producer and clinic efficiency. The data gathered here will be instrumental in improving your clinic’s appointment booking and proposed treatment completion averages, and, ideally, highlight any areas of concern worth investigating.
This report relies heavily on Scheduler records and standard scheduler use. If you experience difficulties generating valid information, check with our Support team.
Step-by-Step
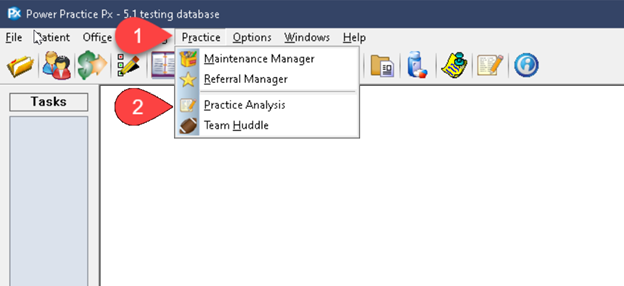
- Visit the Practice menu atop the program window.
- Select Practice Analysis.
- Select the Productivity tab.
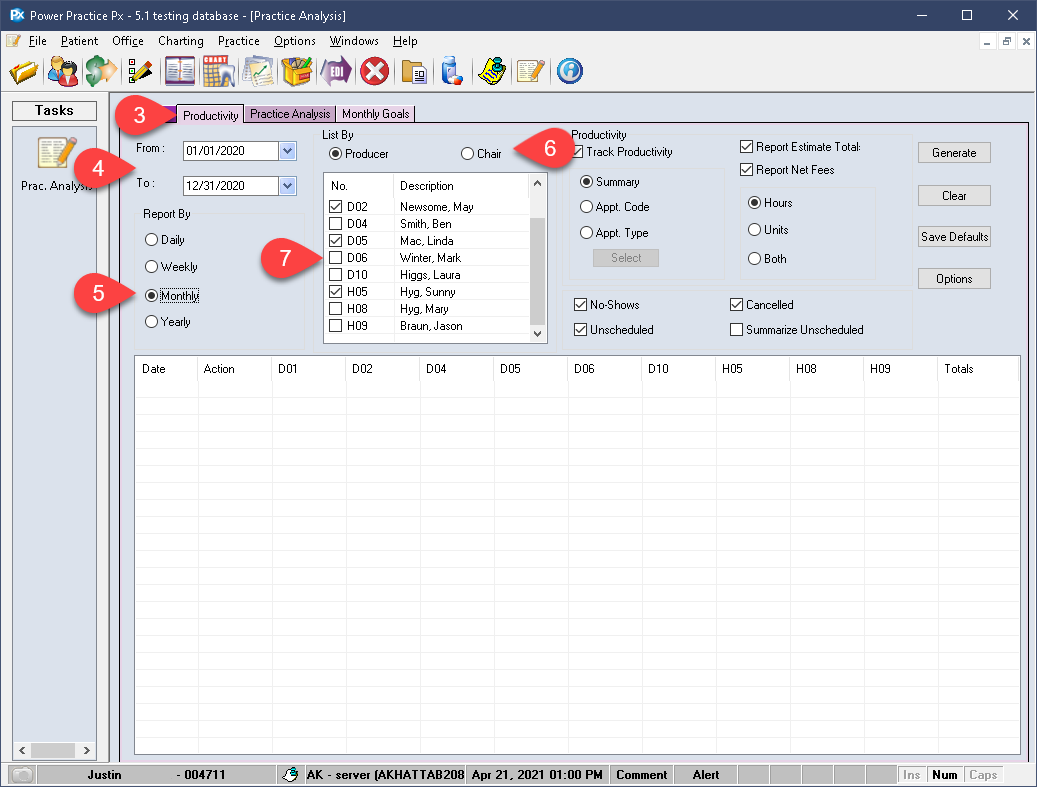
- Begin by setting your From and To dates.
- Report By can be set to your preference, this article will use the Monthly option.
- Next, set whether to list results by Producer or Chair. In most cases, Producer is the best option but if your clinic uses shared chairs you may wish to report by Chair instead.
- You can then select which producers (or chairs) to include in the report. Use For All if you wish to include all of them, however this option is not recommend in most cases; if your practice has been active for a number of years, you may have disused old producers and chairs in your database. These will litter the results area with irrelevant information.
- Track Productivity must be enabled. Choosing to disable it will limit your results to reporting on Cancellations, No Shows and the other appointment scheduling statuses only.
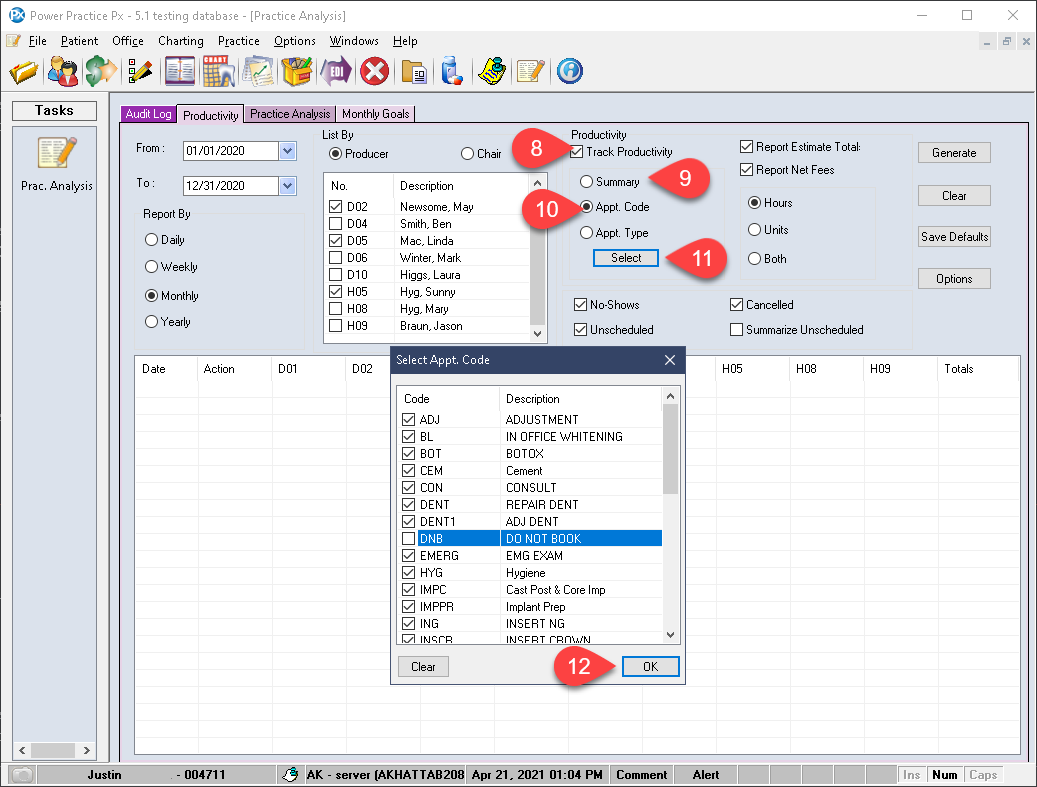
- You can report by Summary, providing an easy to read total number of appointments. This will provide a neat and condensed total, keeping your report brief and tidy.
- Alternatively, you can use Appt. Code or Type if you prefer to see the results broken-down based on those parameters. This setting will produce a line for each appointment code in the system. This would be ideal for finding out how many Filling or RCT appointments were booked in a given time period but tends to make your results really messy when compared to a summary.
- Choosing to use Code or Type will make the Select button beneath them available for use. This will help you specify which ones to include and which to exclude.
- If you chose to report by Code or Type, make your selections in the Select window and select Ok.
For the purposes of this article, the Summary option will be used. This will keep the report “tidy” and easy to read.
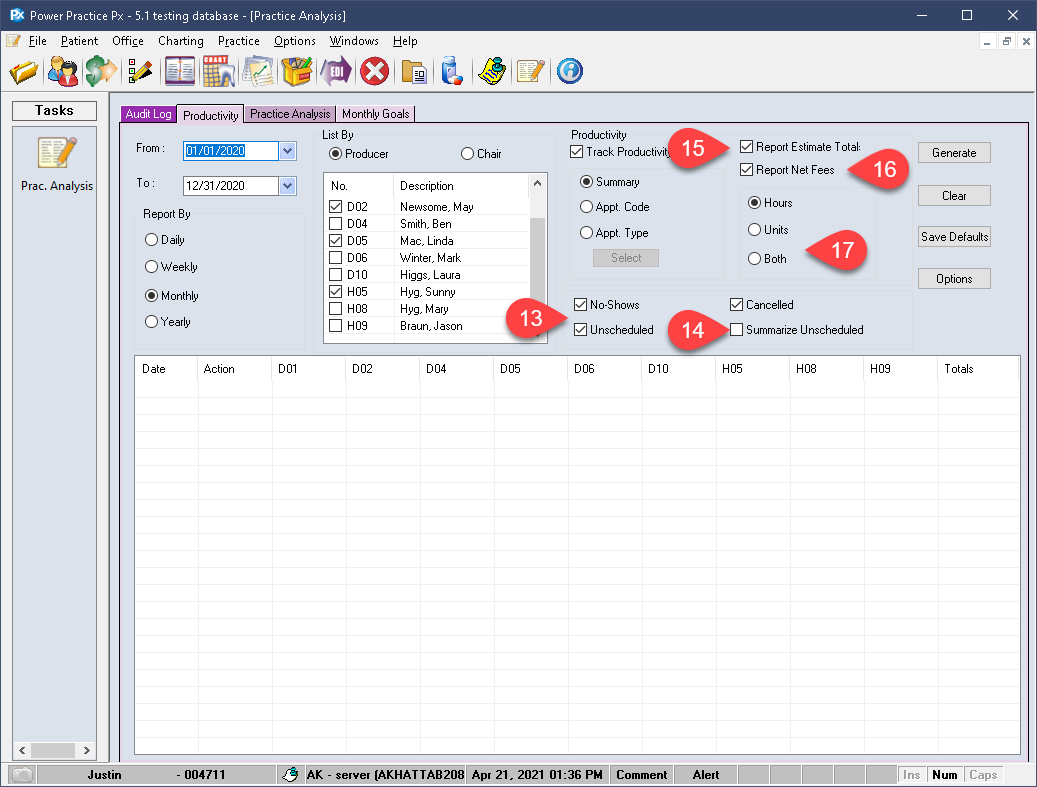
- Select which Unscheduled types of appointments to include in your report.
- Summarize Unscheduled will compress all these data points into a single summary line.
- Report Estimate Total will provide a rough dollar estimate based on the preset values associated with the appointment code. This would be based on the pre-set appointment code’s estimated fees; this does not refer to insurance estimates or policy limits in any way. If your office has not designated a specific estimated value for each appointment code in the Scheduler, you can safely exclude this selection box or ignore the Estimate line on your reports.
- Report Net Fees will include a line to display a production total. This will be based on treatments entered for patients whose appointments are within the set date range.
- Your chair or producer Usage % can be broken down into Hours, Units or Both. This calculation is based on the difference between Booked and Available time, the white vs. gray spaces on your Scheduler.
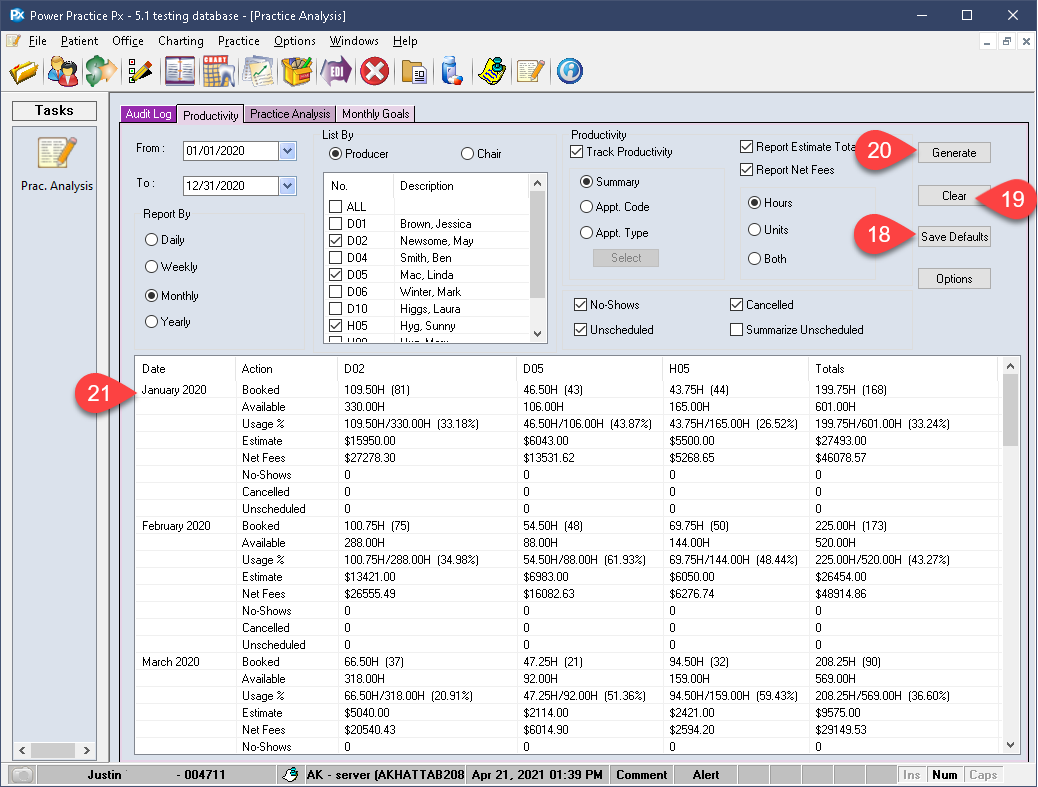
- You can choose to preserve your setup by selecting the Save Defaults button on the right. This will ensure your report opens with these parameters pre-set each time.
- Clear will empty out the results area below, if populated. It does not clear your settings.
- Select Generate to produce your results. We will return to discuss the Options button shortly.
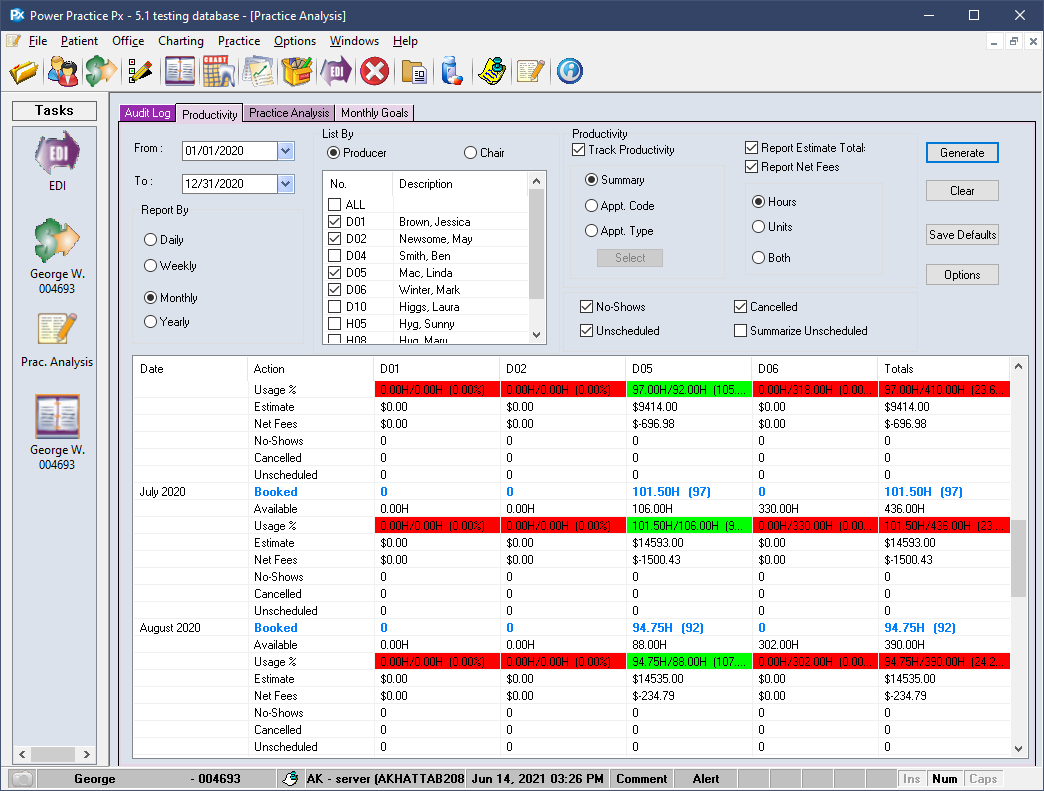
- Your results are broken down based on your report method. In this case, Monthly.
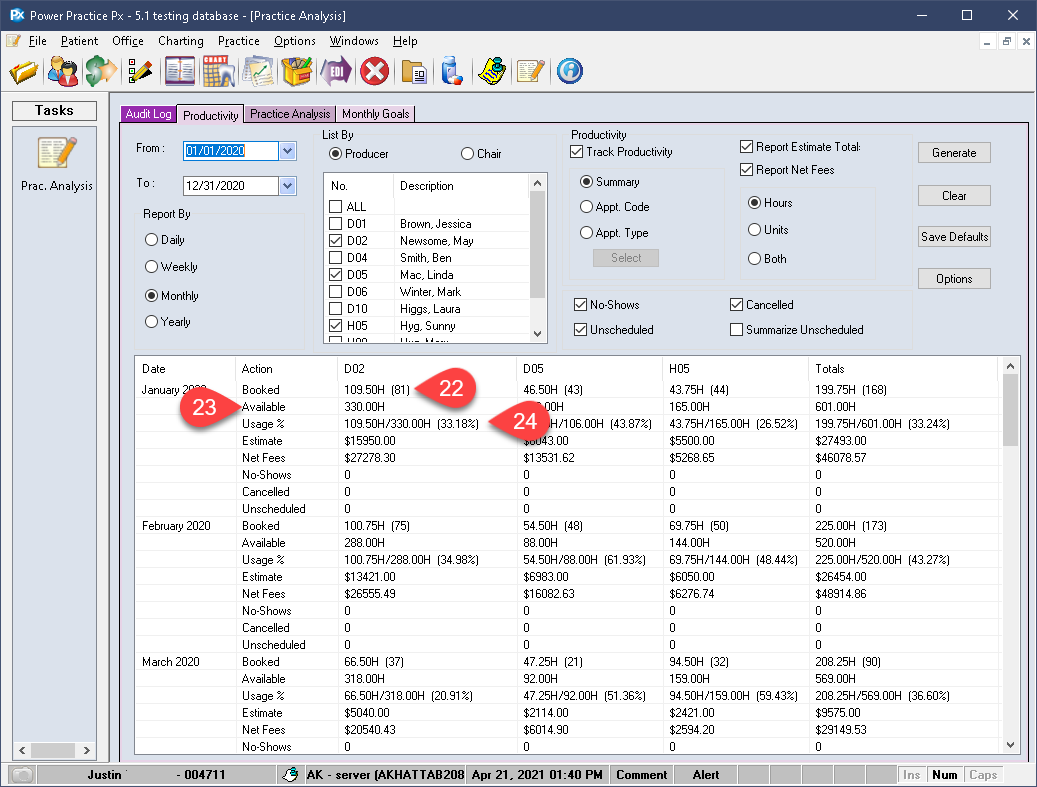
- The Action column contains a lot of lines which warrant explanation. Starting with Booked, this will show how many B status appointments are found within the date range. The number in the bracket shows the total number of bookings.
- Available lists the amount of time/unit slots which were not booked/used. The “white space” used to indicate availability on the Scheduler.
- Usage % finds the difference between the preceding two lines and reports the total as a usage percentage. In the image used you can see that breaks down to 33.18% for D02. This means D02 was booked for 33.18% of their total available time slots.
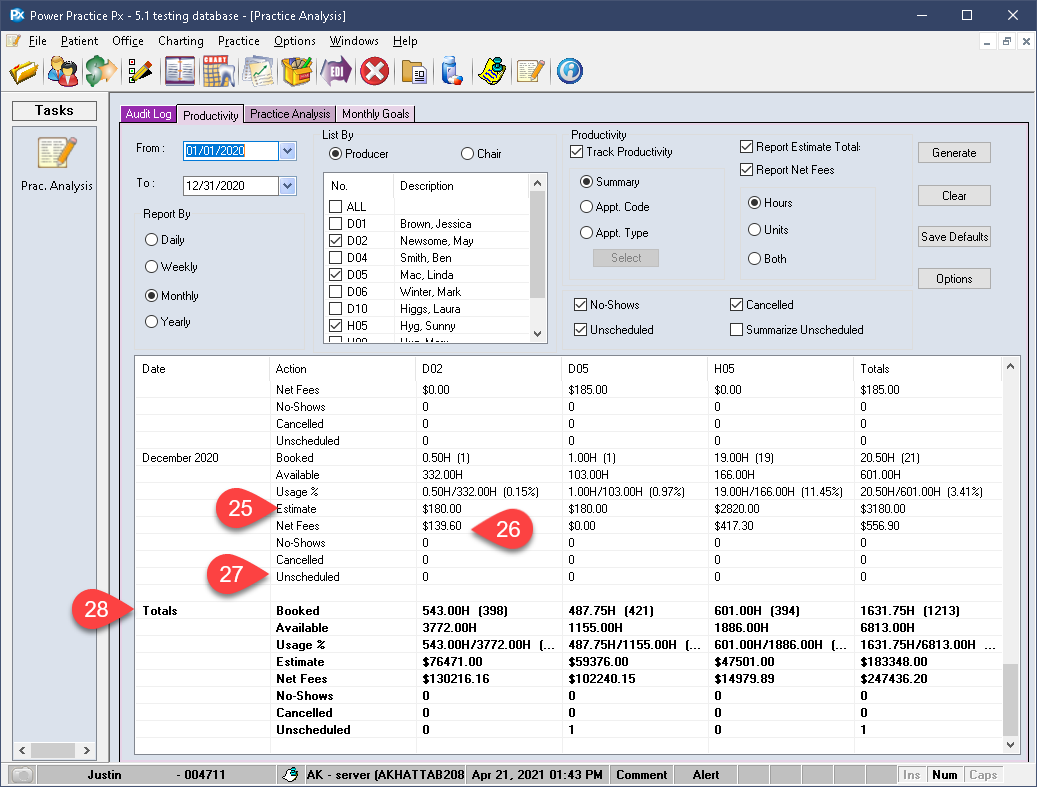
- The Estimate line presents the previously discussed appointment code estimate value. Each appointment code can be set to have a default, rough dollar estimate associated with it. The Estimate shown here is the sum of those values. Again, if your clinic does not use that feature, disregard this line entirely or disable it from the selections above.
- Net Fees is a far more accurate estimation of your production in the given date range. This field refers to the Transaction records associated with the dates of patient appointments to draw a far more accurate production estimate total. This estimate will account for adjustments made to the claim on that day.
- Finally, the Unscheduled types you chose to include are broken down for review, or summarized into one line if you chose to do so.
- A Totals line is given at the end which summarizes all producers included in your report and date range.
Options:
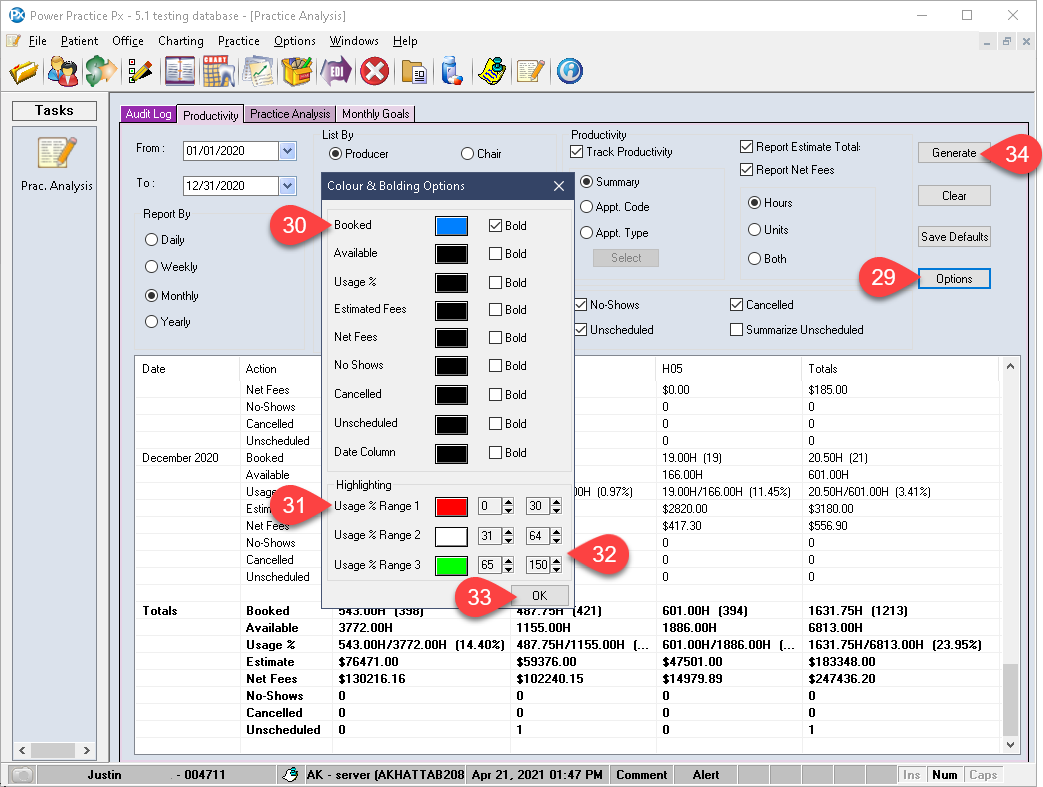
- Visit the Options button on the upper right side. This window gives you an opportunity to set custom colours and bolding options for each of the report lines.
- For example, you can set the Booked line to show in blue font and bolded if you’d like.
- The Highlighting options at the end will interact with your usage % totals and colour code your results based on your setup. E.g. the first range can be set to show 0-30% in red font.
- We can set the other 2 ranges to cover the remaining values and designate their own colours. The idea here is to make results easier to review at a glance.
- If you’ve made any changes to this window, you will need to select the Ok button to commit to them.
- Selecting Generate will produce your report with the new Options enabled.
