To start, visit the Office menu at the top left of the program window and choose Info Manager.
was successfully added to your cart.
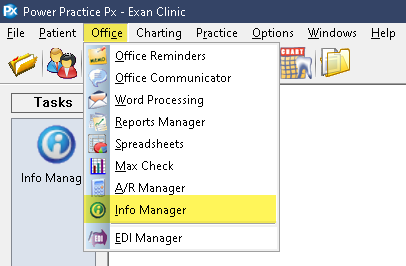
To start, visit the Office menu at the top left of the program window and choose Info Manager.
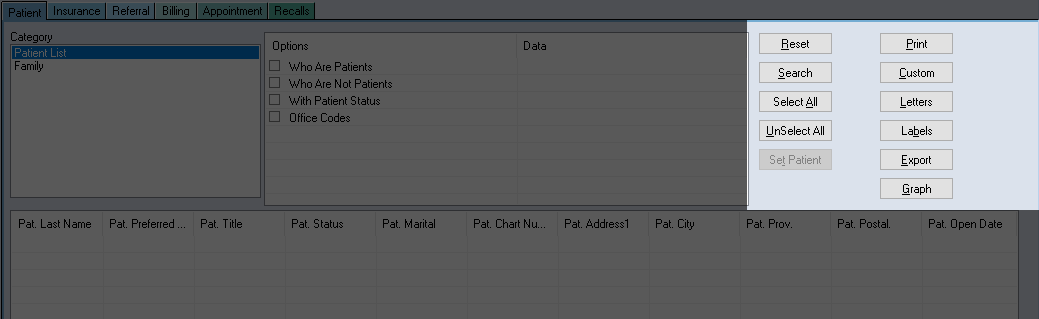
The module window appears. We can immediately differentiate between a few distinct areas:
Let us begin by breaking these sections down first.
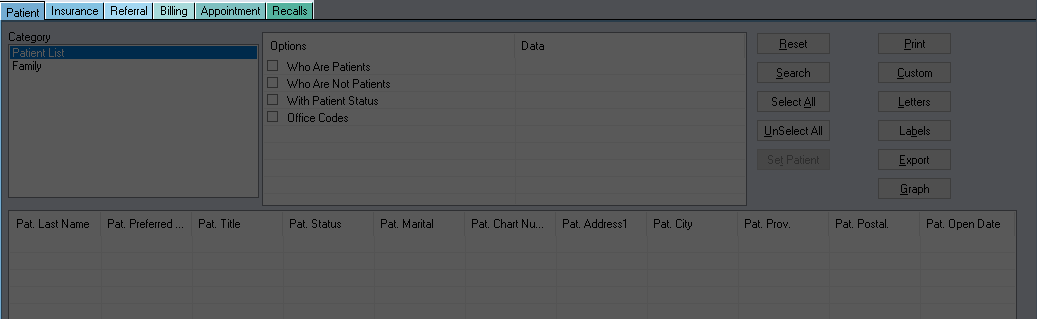
The Tabs:
Across the top left side of the module window are the available Tabs. These tabs designate different sections within the program that can be reported on. Choosing the tab you wish to work under should always be your first step. They dictate the available selections of data tables you can access and report on. While no Tabs are completely exclusive, there are some tabs which do not crossover with others.
This is most apparent in the Referral tab. Reports built under the Referral tab will not be able to include categories found under the Billing tab or insurance tab, for example.
By contrast, the patient tab, selected by default on launch, will allow you to include criteria like appointment date and related information, billing and insurance related fields, notes, recalls and much more. The Patient tab is undoubtedly one of the most flexible to work with, providing the most cross-over of all tabs on offer.
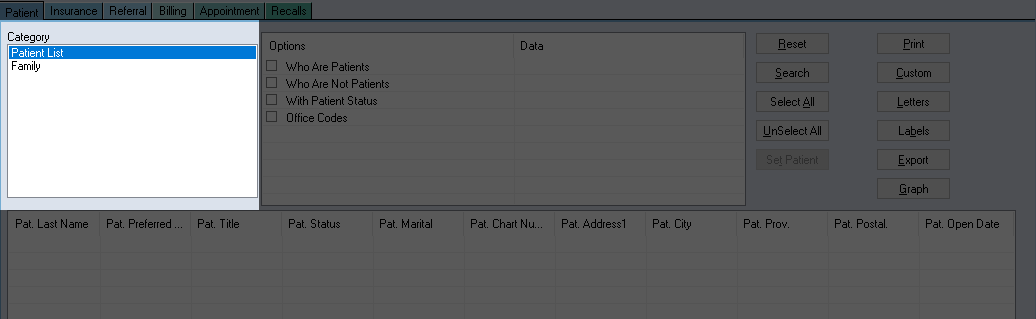
The Categories:
Categories can be thought of as focus-lenses, a means for clarifying what it is you are looking for. You will find the Categories clarify the target of the report. This can be seen clearly when working in the Billing Tab. Billing is generic and can refer to any number of options. So, if we are seeking information about Adjustments, for example, we would visit the Billing tab and choose the right category, Adjustments, to maximize the available reporting options.
Note that different categories will have access to different data sets, just as different tabs alter the available selections. What is available under one Category may not necessarily be available in another, even though they are both found under the same tab.
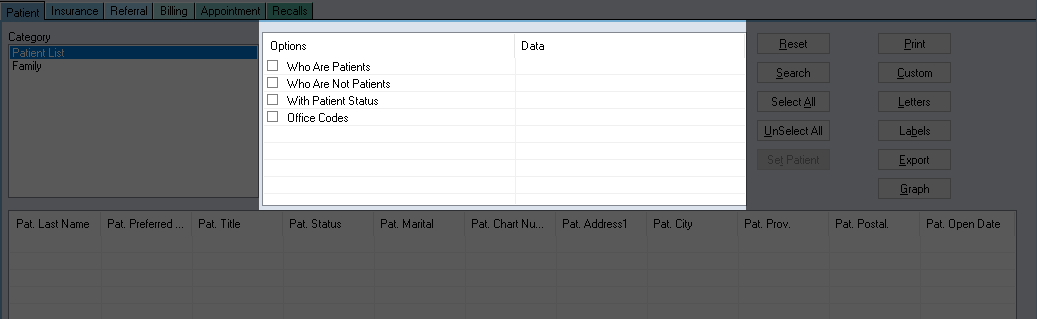
Options:
The selections available in the center-top within the Options box allow you to quickly generate some simple results. A great example is the default Appointment Tab settings. You can set a date filter for a specific date and immediately generate the information you are looking for.
The drawback to these options, however, should encourage you to use the proper filtering method we will soon discuss. The Options settings are not meant to be the primary filter setting location. They are just there for convenience. For these reasons, we will not be covering the Options selections for the remainder of the course.
The Buttons:
The buttons on the right serve to generate the report, print it, export it and more. We will explore the more complex options like Letters and Labels later in the course. The selections will become more familiar in time but the key buttons to keep in mind are Search and Print.
The Search button will always generate results, even without any filters or operations set. The only time this button will not produce results is when your filters rule out all possible returns.
The Print button will give you a list of all available printing options. If you are using Windows 10, you can choose the Microsoft Print to PDF option and save your file digitally instead of printing it. These files can then be emailed, archived or printed later.
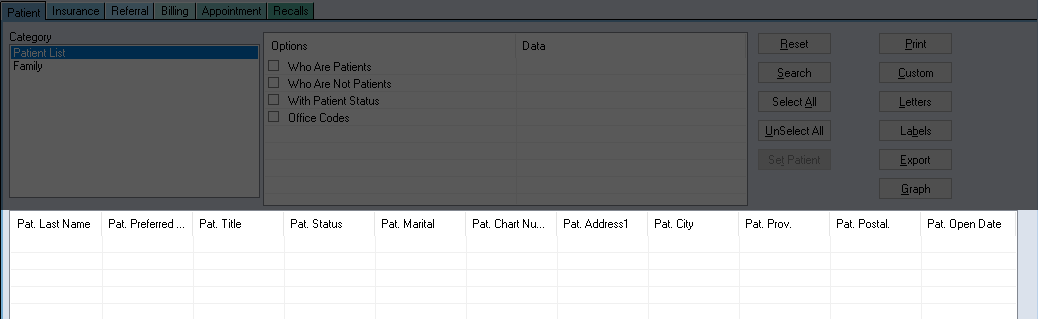
Reporting Area:
The majority of the module is composed of the white grid and columns underneath the settings areas we just discussed. This grid is where data will populate when we generate our reports. We’ll delve into much more detail as we begin customizing reports and learning how to filter them.
The grid is also the area from which we can access the right click menu and the options it makes available. Try right clicking with the mouse anywhere in the grid.
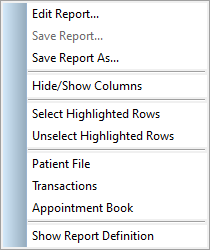
Right Click Menu:
The options in here will provide a shortcut to various parts of the program. We will use the Edit Report option quite a bit throughout the course, as well as the Save functions.
The modules listed will help you get around the program quickly when used in combination with the Set Patient button at the top right.
