Description
version 5.1+
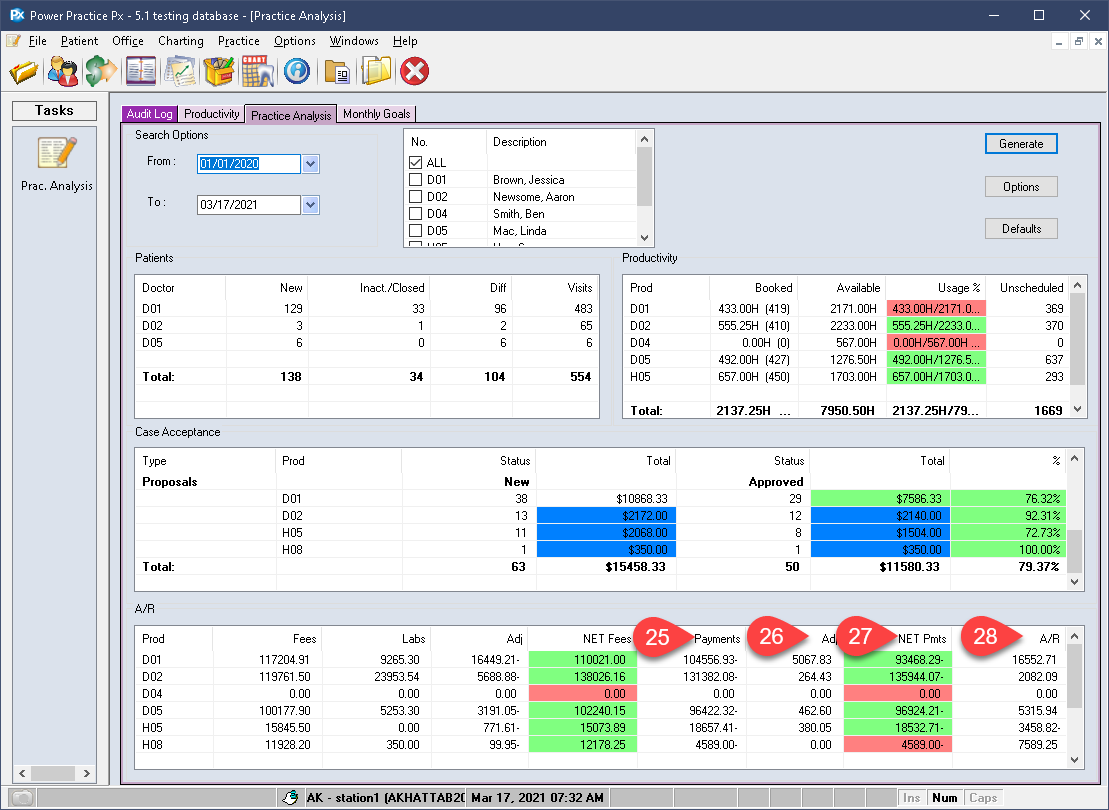
The Practice Analysis tab is a new addition to the Practice Analysis collection of reports. It will gather several key analysis points for the given date range and producers.
Step-by-Step
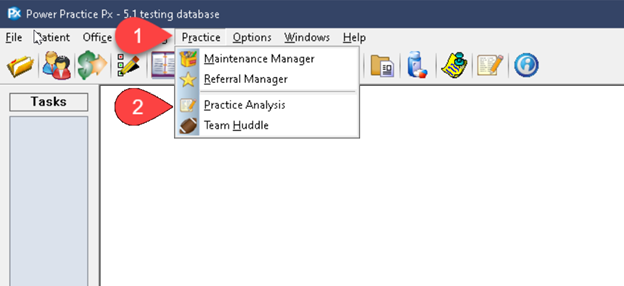
- Visit the Practice menu dropdown atop the program window.
- Select Practice Analysis.
- Set the tab to Practice Analysis.
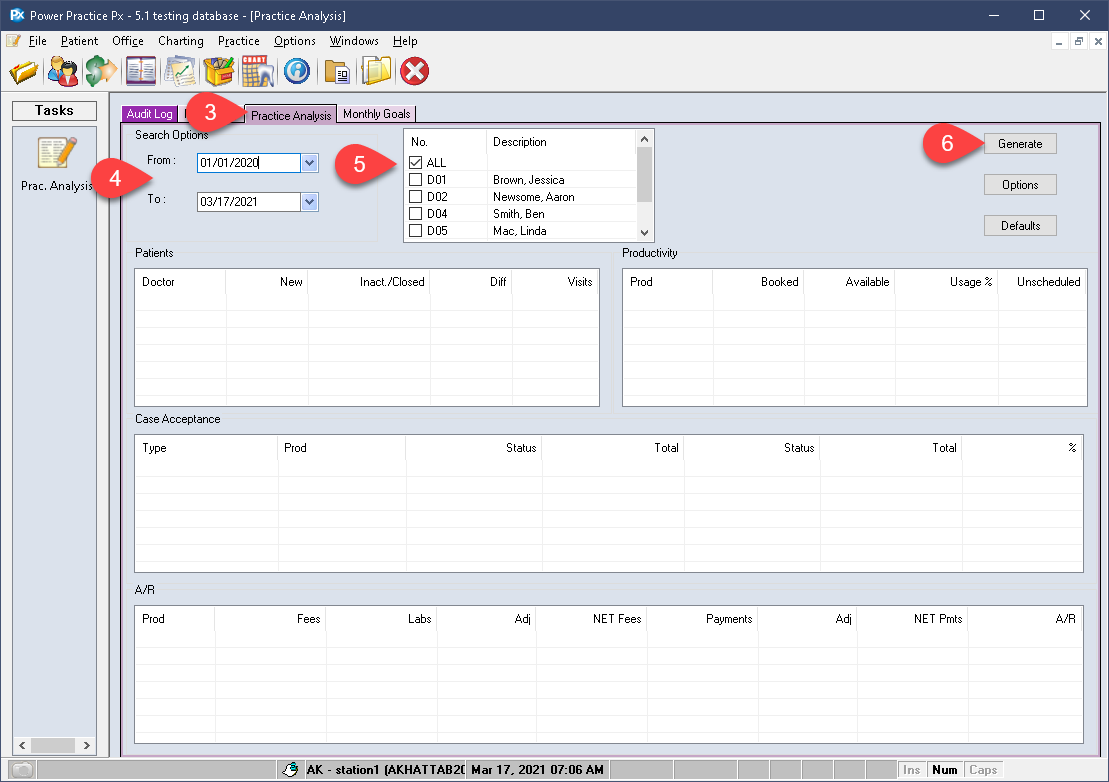
- Set your From and To Date range.
- Select the producers you wish to see included. The option, For All may be ideal.
- Select Generate.
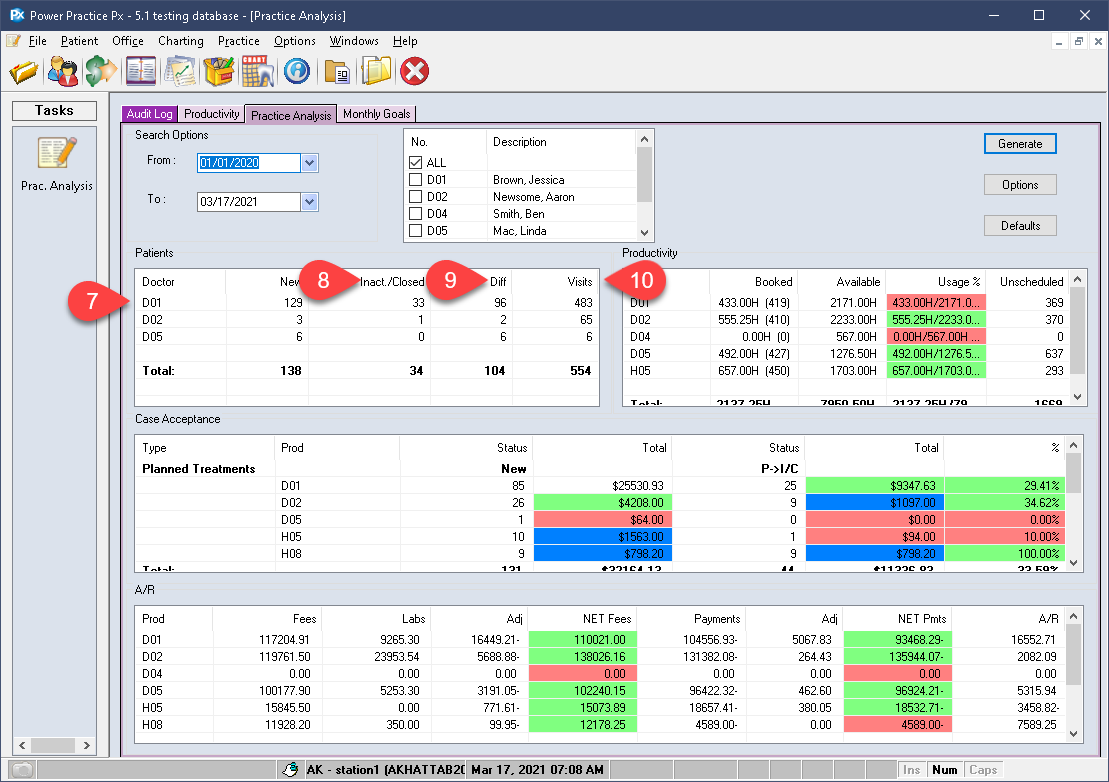
Your search results are broken down into separate categories, the first of which is Patients.
Patients:
- Each Dr. is given a total number of New patients.
- The total Inactivated or Closed files are also tallied.
- A Difference between the first two fields is calculated automatically.
- Finally, the total number of visits is listed.
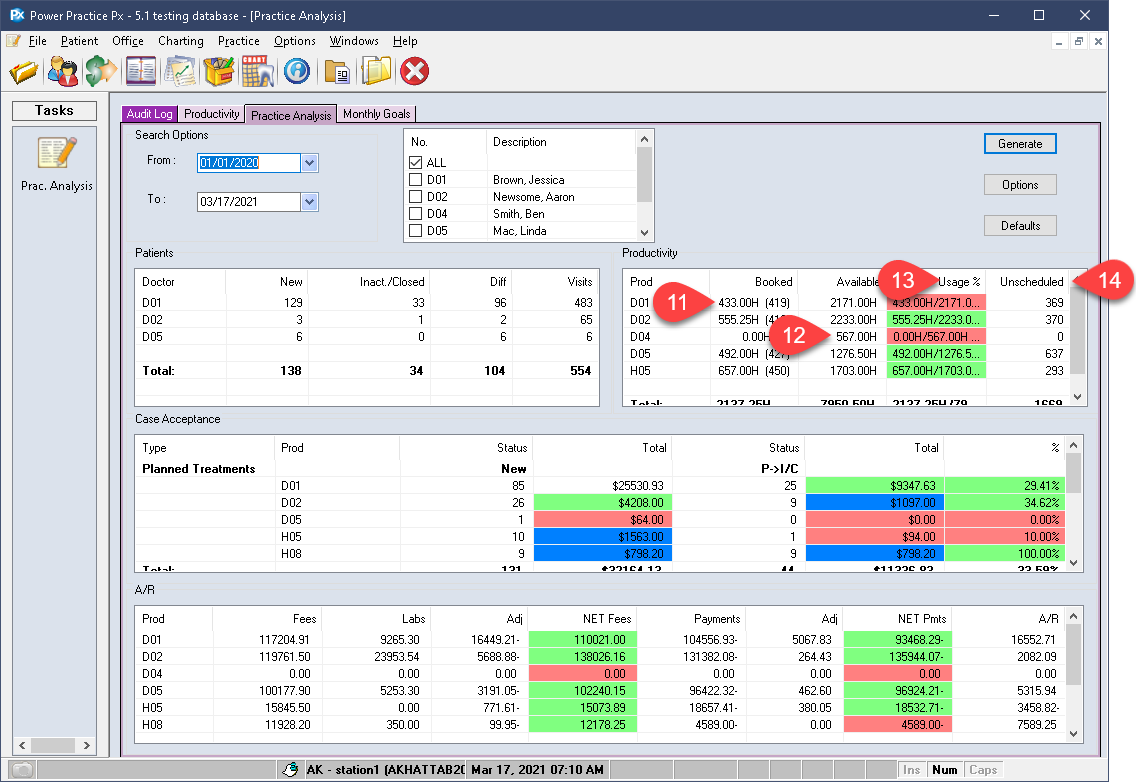
Productivity:
- The total number of Booked hours is listed first.
- The total Available hours this Producer had in the given date range follows.
- A Usage breakdown will calculate the efficiency percentage. I.e. the producer’s available units (white space on scheduler) are compared against their booked units to provide a percentage breakdown.
- Finally, the Unscheduled appointments are summarized at the end.
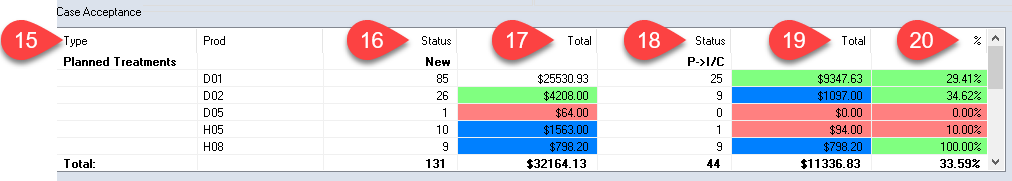
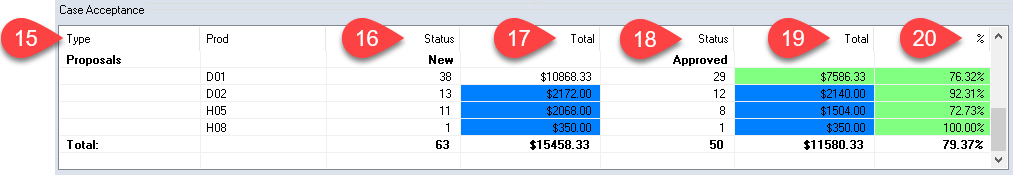
Case Acceptance:
This section will cover two items, Planned Treatments and Proposals. Both topics will follow nearly identical column breakdowns.
- The Type column clarifies whether the information presented is for Planned or Proposed items.
- The New column lists items posted during the given date range.
- A Total dollar value is estimated from the treatment’s standard prices.
- The Status column shows Planned or Incomplete to Complete transitions when reviewing Planned Treatments. The Proposal section will reflect Accepted cases instead.
- The next Total column represents the estimated dollar value for the Accepted or completed Planned items.
- Finally, a Percentage breakdown clarifies how these values add up.

A/R:
The A/R summary presented at the end of the report presents a very informative snapshot of all included Producer A/R.
- The Producers are listed first, followed by their Fees billed for the given date range of the report.
- Labs are calculated separately for ease of use.
- The first Adjustments column relates to fee adjustments, like Fee Write Offs.
- These columns are then added up to give you a Net Fee total.
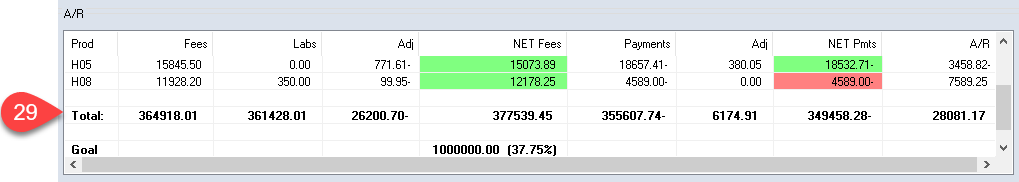
- Next, payments are listed.
- The adjustments affecting those payments are then shown. Items of this category include Credit Write Offs and the like.
- Net Fees are factored from the two payment columns to give you a total.
- Finally, the Producer’s current A/R is shown.
- The Totals are summed up underneath the Producers listed. These reflect your Practice totals as a whole. The clinic Production Goal value is also shown in this row. We will set this value in the next steps.
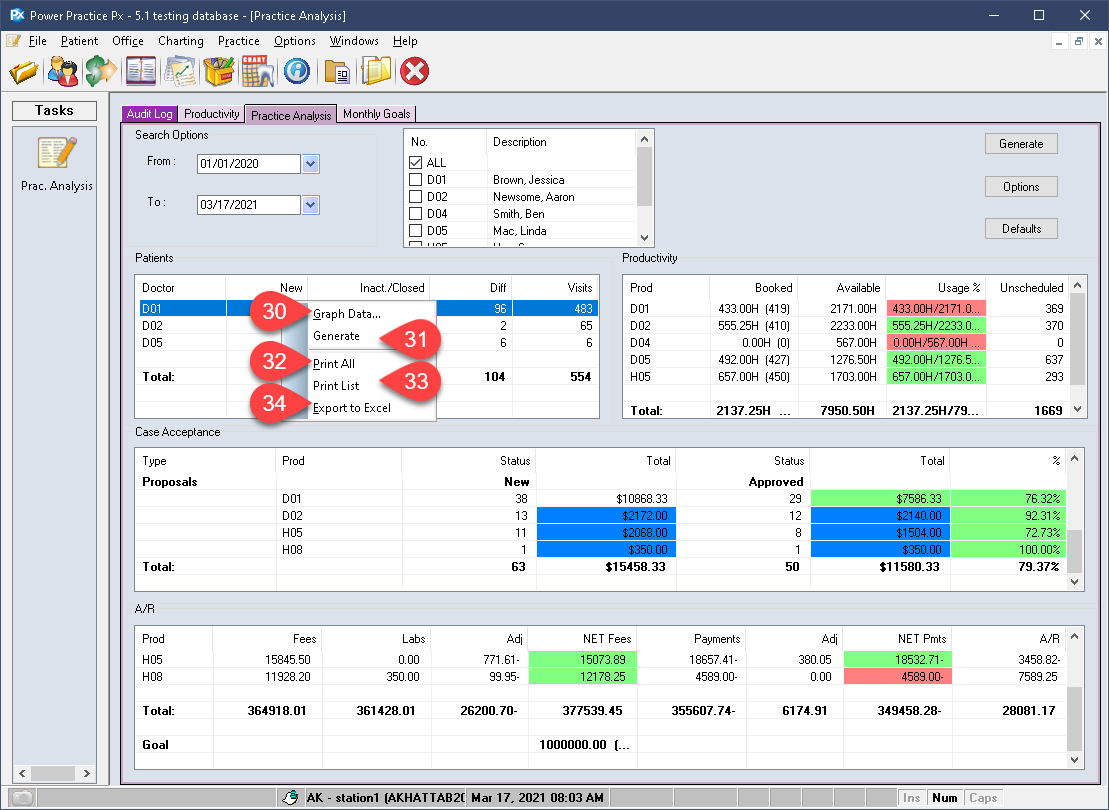
Right Click Options:
Right clicking within the results areas will provide a few options to choose from.
- Graph Data will allow you to visualize the information on a Graph type of your choosing.
- Generate will simply renew the information for the box you right clicked on.
- Print All will produce a printout of all the fields reported on.
- Print List will only print the information found in the box you right clicked on.
- Finally, Export to Excel allows you to import the data for further analysis.
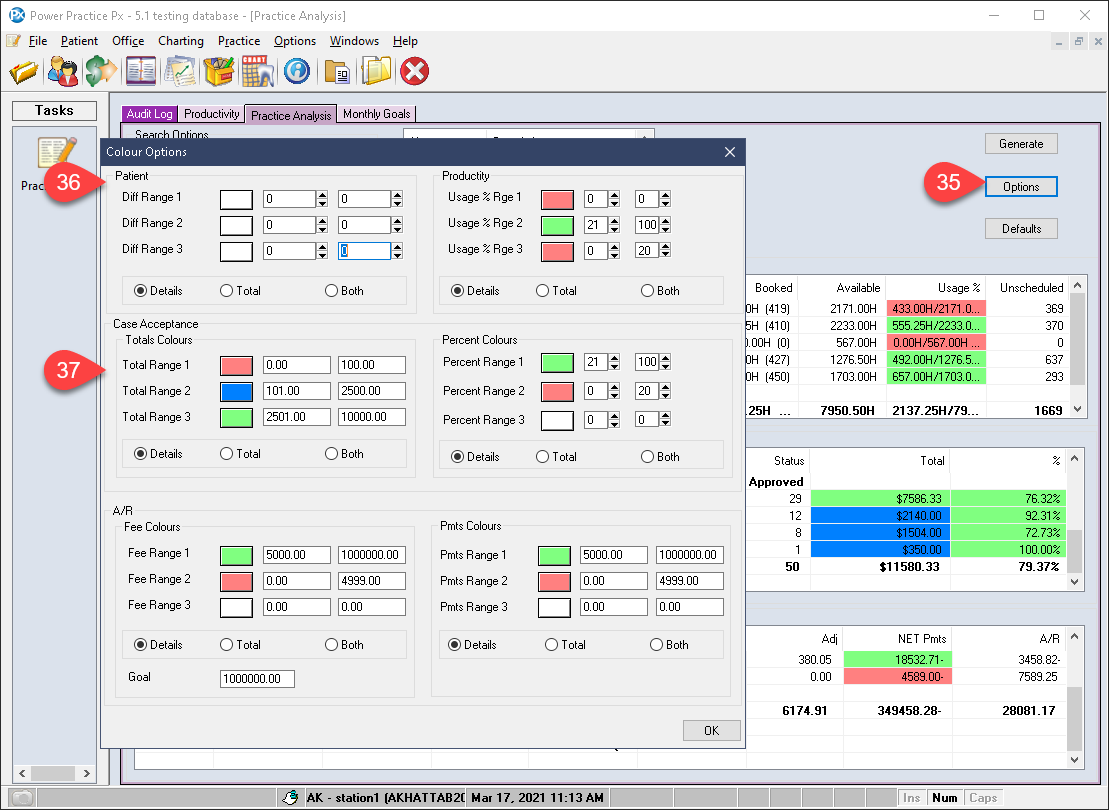
Options:
The Options button contains a few preferences which can be set to your liking.
- Select Options.
- You will find a set of range and colour options that can be applied to each category on the report. The Patient area in this image has been left unchanged.
- The Case Acceptance ranges have been custom set. You have the option to use up to 3 subdivisions/ranges. Selecting the coloured square icon will allow you to set a custom colour while the boxes beside it allow you to specify the values to be used. Finally, the bullets below define whether to apply these colours to the Total amount only or Both, as shown in the image.
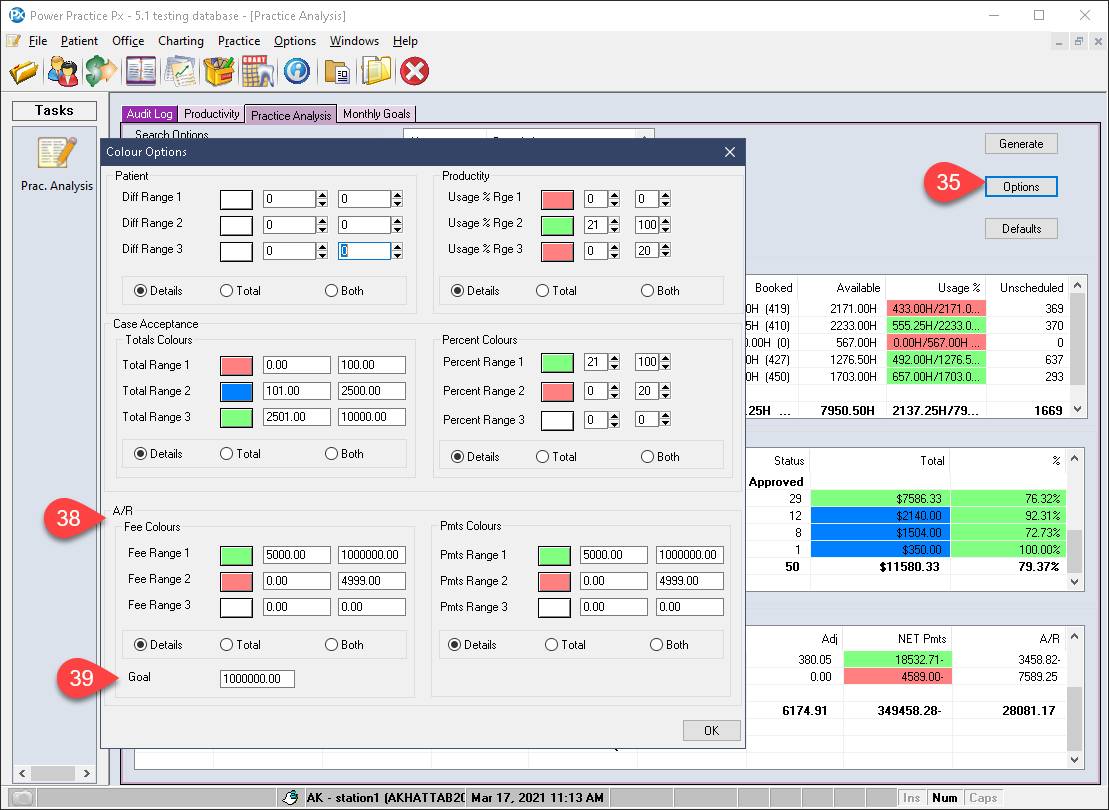
- The remaining A/R and Payment options follow the same principles as the above described.
- The Goals field can be used to designate a target production value for the report. You will need to remember to visit the Options to set it appropriately based on the date range you are using for the report at that time.
